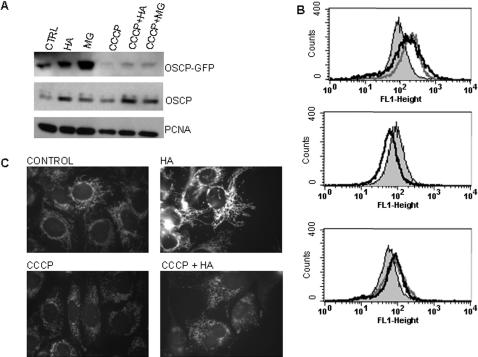
Figure 9. Hsp90 and proteasome inhibitors increase OSCP levels post-mitochondrial import.
(A) Western blots of 143B cells transfected with OSCP-GFP and treated with HA (0.5 µM), MG132 (0.5 µM), and CCCP (10 µM) for 18 h. (B) Flow cytometry histograms of GFP fluorescence after 18 h of treatment. Top panel, filled histogram: control; open histograms: HA (light grey), MG-132 (dark grey). Middle panel, filled histogram: control; open histogram: CCCP; Bottom panel, filled histogram: CCCP; open histograms: CCCP+HA (light grey), CCCP+MG-132 (dark grey). (C) Fluorescence micrographs of GFP fluorescence in cells treated with HA, CCCP or CCCP plus HA for 24 h.

