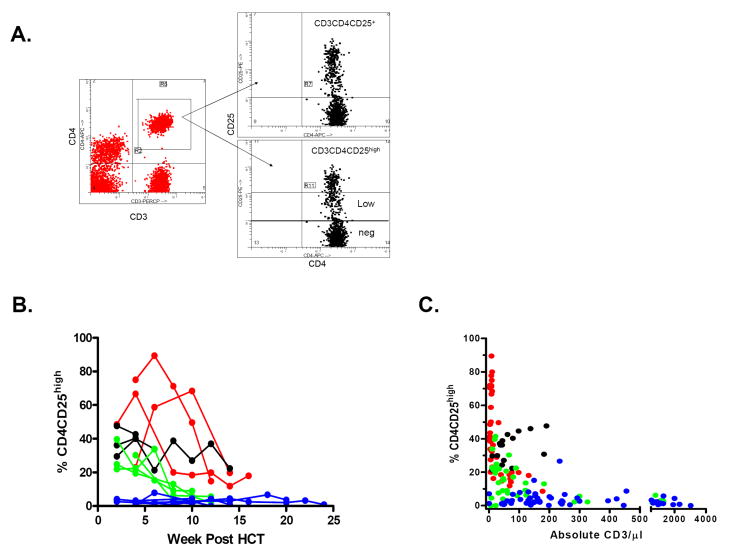
Figure 3. CD25 expression on recovering CD4 T cells following non-myeloablative SCT.
A: Gating for analysis of CD3+CD4+ cell subpopulations in a representative patient with a high proportion of CD3+CD4+CD25high cells. Gates for the sorting of the CD3+CD4+CD25 high, low and negative (neg) populations are indicated.
B: Proportions of CD3+CD4+CD25high cells over time after HCT for individual patients (Red: Protocol A, Black: Protocol B, Green: Protocol C, Blue: Protocol D.)
C: Inverse relationship between CD25 expression on CD4 T cells and CD3 T cell recovery in recipients of MEDI-507-based non myeloablative haploidentical SCT protocol. (Red= Protocol A, Black=Protocol B, Green=Protocol C, Blue=Protocol D.) P<0.0001 and <0.006 for Protocols A and C, respectively. Patient B1 was excluded from analysis after the administration of anti-CD25 mAb Daclizumab (Zenapax) on Day 45 for the treatment of GVHD. Patient B4, who demonstrated an unusual T cell phenotype in which the majority of CD3+ T cells expressed CD45RO, CD45RA, and CD25 at all times, was also excluded from analysis. Patient D3 had CD4+CD25+ HTLV-1 lymphoma detectable in the peripheral blood, and therefore was excluded from this analysis.

