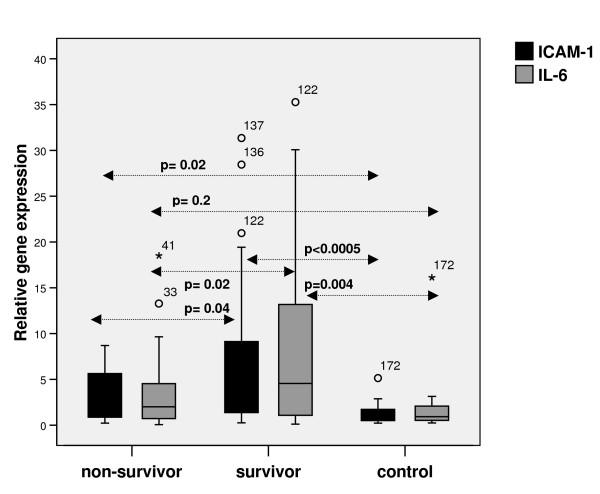
Figure 3.
Box and whisker plot of relative gene expression in the ICAM-1 and IL-6 genes in survivors (n = 62), non-survivors (n = 25) and controls (n = 16). The dark line represents the median, and the box represents the interquartile range. The whiskers represent the range, and outliers are depicted as small circles.

