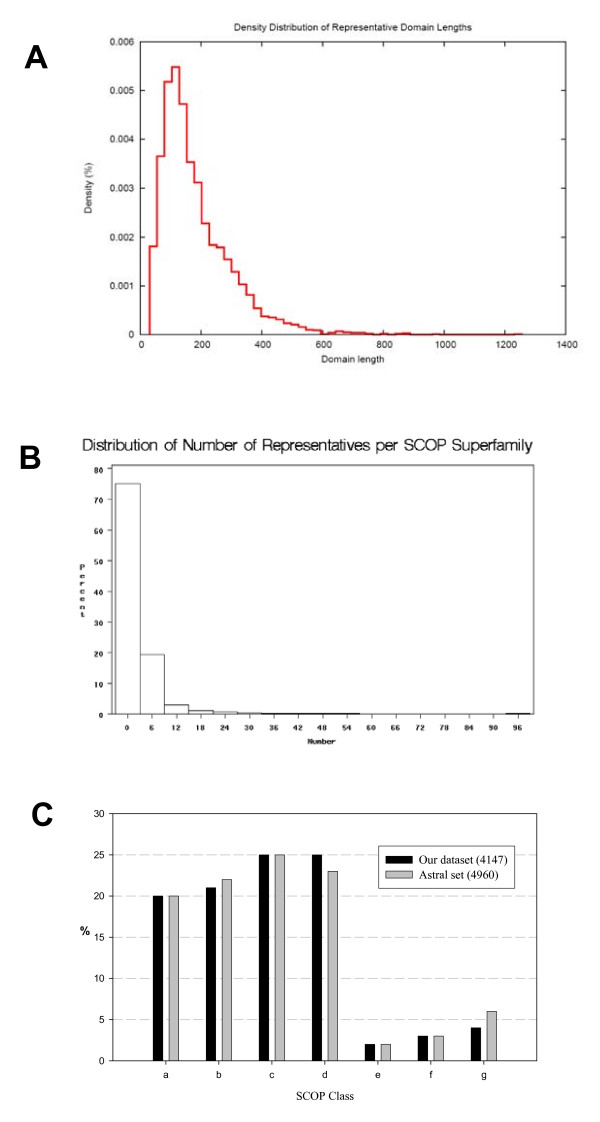
Figure 2.
Distributions of properties of representative domains. A. Distribution of domain lengths. B. Distribution of number of representatives per SCOP superfamily. C. Distribution of number of representatives per SCOP class. Black bar shows the distribution of our representative dataset (4147 domains). Gray bar shows the distribution of Astral SCOP20 set (4960 domains). The x-axis shows the abbreviate names of the SCOP classes. a: all alpha proteins; b: all beta proteins; c: alpha/beta proteins; d: alpha + beta proteins; e: multi-domain proteins; f: membrane and cell surface proteins and peptides; g: small proteins.

