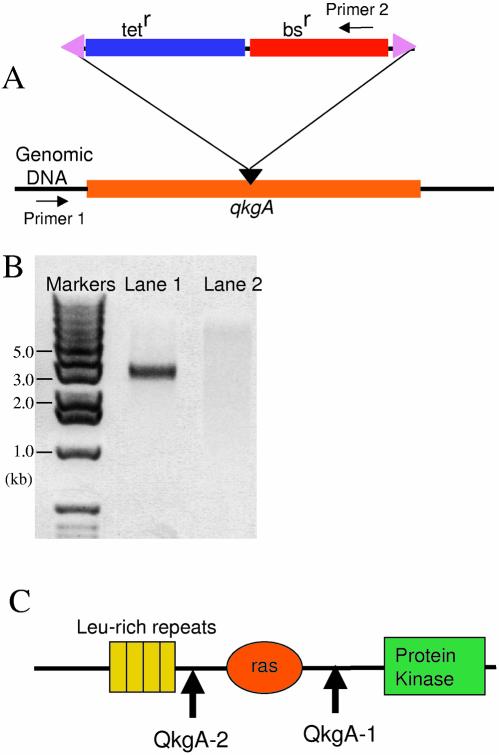
Figure 5.
PCR confirmation of insertion of the transposable bsr cassette in the qkgA locus and determination of the transposon insertion point. (A) A schematic diagram of the qkgA locus and the inserted bsr cassette. The orange line indicates that part of the qkgA open reading frame which was used as the target for disruption. The position of insertion of the bsr cassette is marked with a black triangle. The two primers used for PCR confirmation are indicated with arrows and marked primers 1 and 2. (B) Two examples of clones. Genomic DNA was isolated from the clones grown in selective medium containing blasticidin. Lanes 1 and 2 show the results of PCR with the primers described in (A). The sample analysed in lane 1 shows successful insertion of the selection cassette into qkgA, while the absence of a band in lane 2 suggests a non-homologous insertion of the cassette elsewhere in the chromosome. (C) Following PCR confirmation of transposon insertion in the genomic target, the insertion point was estimated from the size of the amplicons. The arrows indicate the approximate insertion points of two separate clones, QkgA-1 and QkgA-2.

