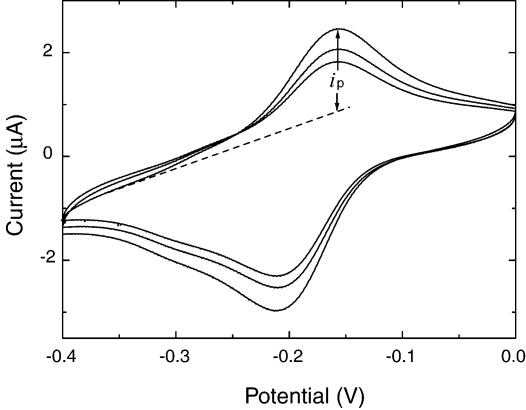
Figure 2.
Cyclic voltammogram for hairpin DNA biosensor versus Ag/AgCl. The initial voltage was –0.4 V and the end voltage was 0, the scan rate was 0.1 V/s, with a sample interval of 0.001 V and sensitivity of 10–6 A/V. The value of ip was defined as the difference between the reduction peak current and the baseline current (dashed line).

