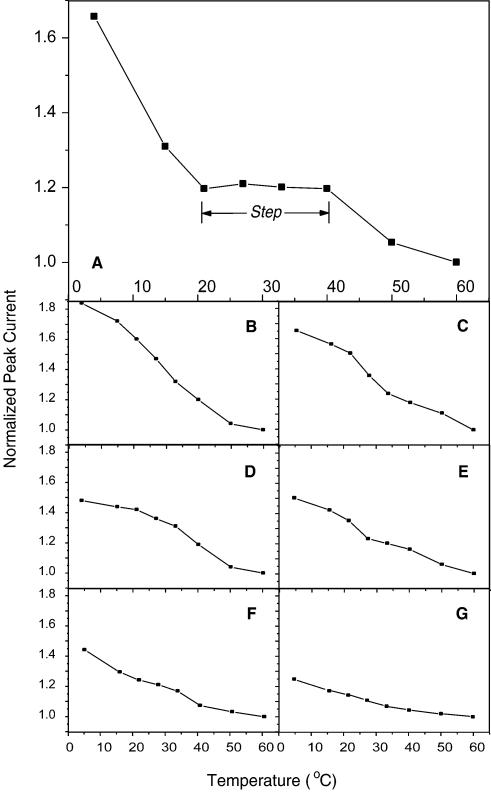
Figure 4.
ip–T profiles of the hairpin loop biosensors detecting different targets. The experimental data were all normalized by means of setting the value of ip at 60°C to 1. (A) Profile of the biosensor after hybridization with perfectly complementary targets. A step is apparent in the profile. (B–D) Profiles of the biosensors for the strands with a single mutation. The mutations are: (B) G→T; (C), G→A; (D) G→C. (E) Profile of probe electrode interacting with unrelated oligonucleotides. (F) ip–T curve of the biosensor without detection of any targets. (G) ip–T curve of PDC-TH-modified electrode.

