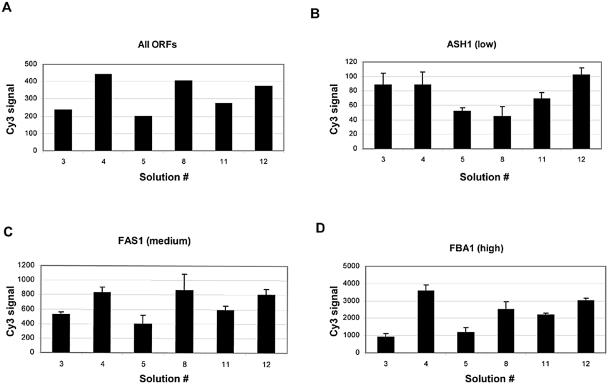
Figure 3.
Bar graphs of the overall background-subtracted Cy3 signal measured for each solution from two replicate slides following hybridization. (A) The average Cy3 signal obtained for all ORFs (n = 192) for each solution on two different slides is shown in this bar graph. Since the levels of expression of the ORFs vary to such a large extent error bars are not included. As a measure of reproducibility, the data (average background signals with error bars, n = 8) for three ORFs representing a low, medium and high expressing gene are shown in (B), (C) and (D), respectively.

