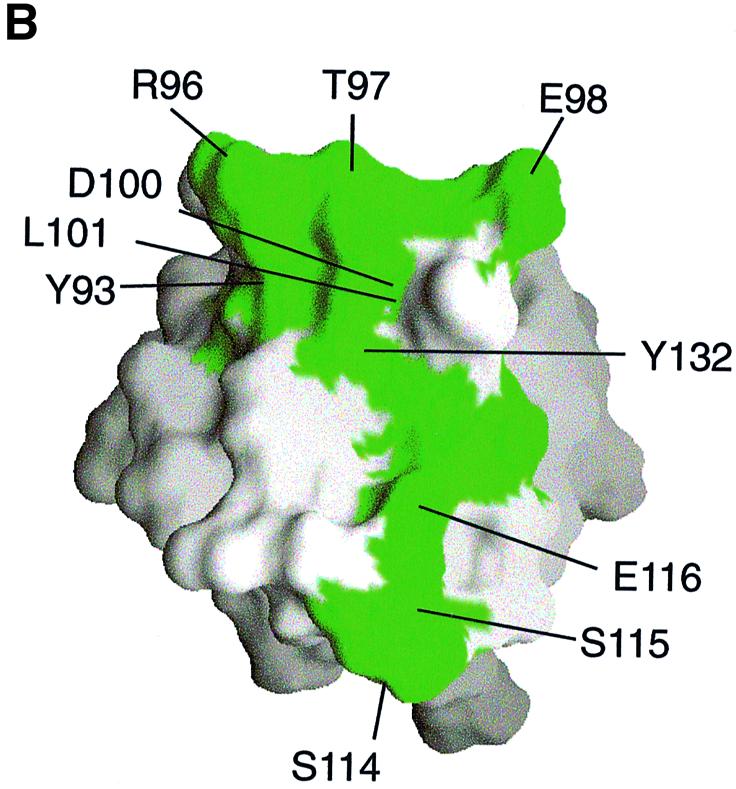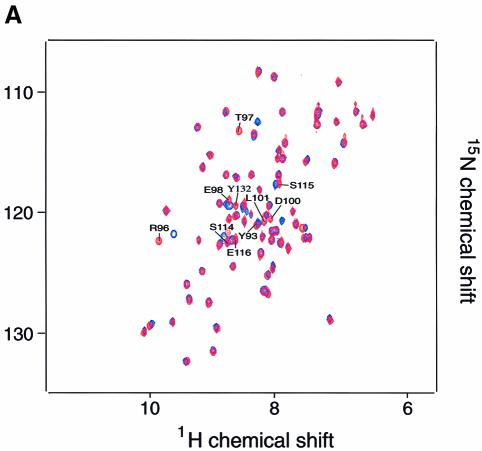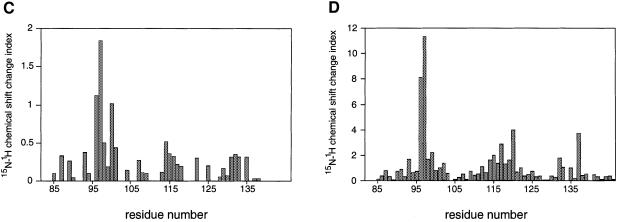
Fig. 5. Two-dimensional NMR spectra of TRAKGDYASYYQG peptide binding to the FYN SH3 domain. (A) 15N–1H NMR correlation spectra of the isolated and complexed FYN SH3 domain. 15N–1H resonances that become significantly shifted upon addition of equimolar amounts of the SK4 peptide ligand are denoted by amino acid type and number within the full-length FYN kinase. The 10 residues that display the largest chemical shift changes upon peptide binding are located in the RT loop (Y93, R96, T97, E98, D100 and L101), the n-Src loop (S114, S115 and E116) and the β-strand (Y132). (B) GRASP (Nicholls et al., 1991) surface representations of the FYN SH3 domain (Morton, 1996). The 10 residues with the largest combined chemical shift index [as in (A)] are depicted in green and are labeled according to residue type and amino acid number within the full-length kinase. (C and D) Combined chemical shift change indices for individual backbone NH groups of the FYN SH3 domain at 0.3 mM upon addition of equimolar amounts of the peptide TRRKGDYASYYQG (C) or PPRPLPVAPGSSKT (D).


