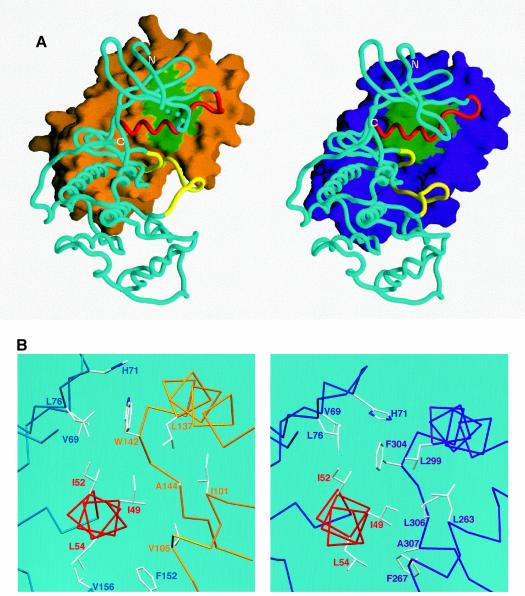
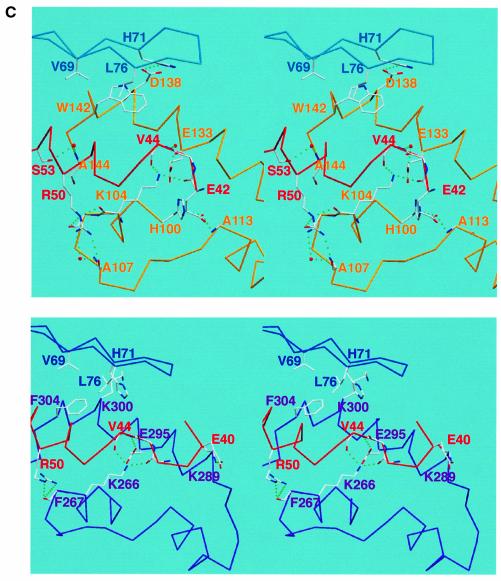
Fig. 4. (A) Surface representation of M-cyclin (gold, left) and cyclin A (purple, right) bound to their respective cdk2 partners (cyan Cα worm). The cdk2 PSTAIRE region is shown in red and the T-loop in yellow for both complexes as in Figure 2. The green surface of M-cyclin and cyclin A indicates the hydrophobic patch, which packs against the PSTAIRE helix. The shift in position of M-cyclin relative to cyclin A can be seen as well as the different contacts to the PSTAIRE helix. (B) Close-up of the hydrophobic patch of M-cyclin–cdk2 and cyclin A–cdk2 revealing differences in their interface contacts. (C) Stereo view of a conserved cyclin–cdk2 interaction centred on the salt bridge between K104M and E133M (top view) equivalent to K266A and E295A (bottom view) as described in the text. Certain residues in this region are omitted for clarity.

An official website of the United States government
Here's how you know
Official websites use .gov
A
.gov website belongs to an official
government organization in the United States.
Secure .gov websites use HTTPS
A lock (
) or https:// means you've safely
connected to the .gov website. Share sensitive
information only on official, secure websites.

