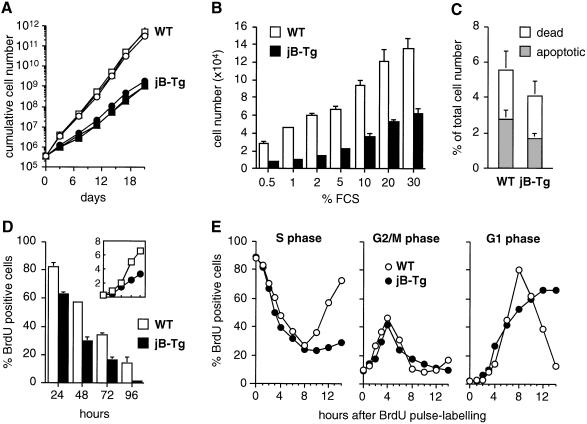
Fig. 2. JunB-expressing 3T3 fibroblasts proliferate slowly with an extended G1 phase. (A) Proliferation curves of WT and jB-Tg 3T3 fibroblasts. The results from three independent 3T3 lines of each genotype are shown. (B) Saturation densities of WT and jB-Tg 3T3 fibroblasts under different fetal calf serum (FCS) concentrations. Values are the average ± SEM of two independent cell lines each measured in triplicate. (C) Numbers of dead cells (propidium iodide exclusion) and apoptotic cells (TUNEL assay) in exponentially growing WT and jB-Tg 3T3 fibroblasts. Values are expressed as a percentage of the total cell numbers and are the average ± SEM of two independent cell lines. (D) Comparative analysis of S-phase cell numbers and proliferation rates in WT and jB-Tg 3T3 fibroblasts. Cells were seeded at 0.4 × 10⁶ cells per 10 cm dish and labelled for 1 h with 60 µM BrdU before harvesting after 24, 48, 72 and 96 h of culture. The total cell numbers were determined (top panel; y-axis, ×106) and the cells were analysed bytwo-parameter flow cytometry to determine the percentage of BrdU positive cells. (E) Analysis of cell cycle distribution in asynchronously growing WT and jB-Tg 3T3 fibroblasts. Cells were pulse-labelled for 1 h with 60 µM BrdU, chased for the periods of time indicated and analysed by two-parameter flow cytometry to determine the percentage of BrdU positive cells in S, G2/M and G1 phase. The numbers of BrdU positive cells obtained after the 1 h pulse were normalized to 100% in the two cell populations and correspond to 62% of the total cell numbers in WT cultures and 24% in jB-Tg cultures.

An official website of the United States government
Here's how you know
Official websites use .gov
A
.gov website belongs to an official
government organization in the United States.
Secure .gov websites use HTTPS
A lock (
) or https:// means you've safely
connected to the .gov website. Share sensitive
information only on official, secure websites.
