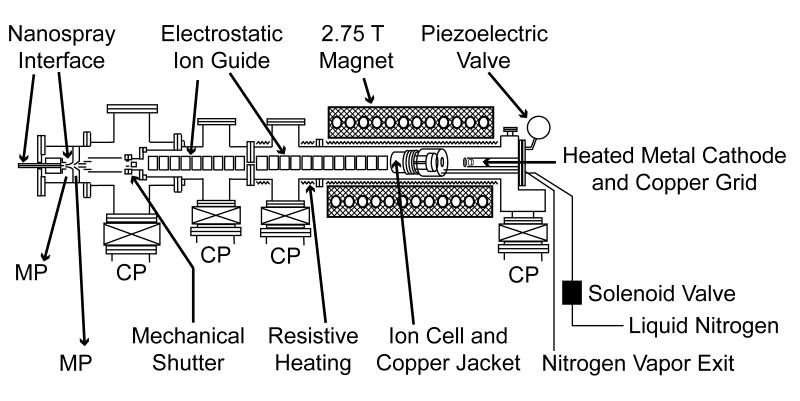
Figure 1.
Schematic diagram of the 2.75 T Fourier-transform ion cyclotron resonance mass spectrometer used in these experiments. This instrument has an external electrospray ionization source, a temperature controlled ion cell that is cooled to 130 K with a regulated flow of liquid N2 and a heated metal dispenser cathode mounted on the central axis of the vacuum chamber and positioned 20 cm from the cell center for generation of thermal electrons for ECD. MP and CP indicate mechanical pumps and cryopumps, respectively.

