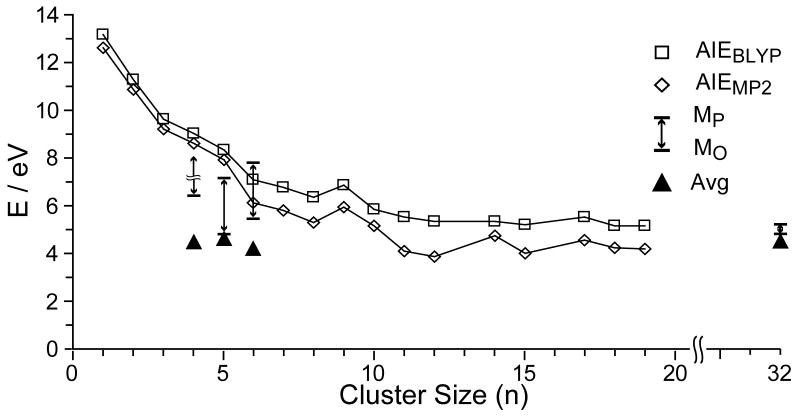
Figure 8.
Comparison of the internal energy deposition from electron capture by , n = 4 – 6, 32, with adiabatic ionization energies of from BLYP (□) and MP2 (◊) calculations from [69] as a function of cluster size. The average energy deposition (Eavg; ▲), as well as the range of energies from the maximum observed (EMO) to the maximum possible (EUL), are indicated. For , no upper limit (EUL) is indicated because MgOH+ is formed. (see text).

