
Figure 2.
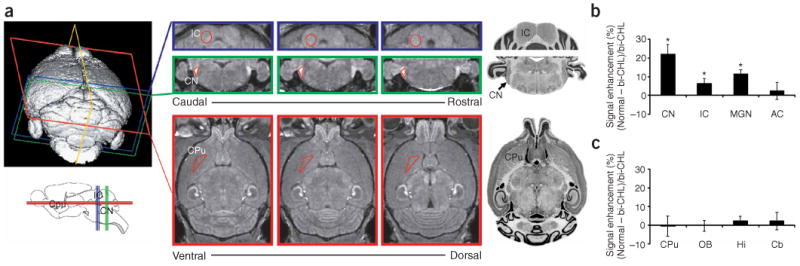
Brain regions were analyzed from volumetric in vivo MRI data. (a) Using 3D MRI data (upper left) with 100-μm isotropic resolution, auditory nuclei and control regions were identified in coronal or horizontal cross-sections (100 μm thick) through each region (central panels), and ROIs were defined (open red triangles or circles) after comparing MRI with a reference mouse brain atlas (right: reprinted with permission from the Mouse Brain Library, http://www.mbl.org). Three representative slices are shown through each of the auditory brainstem nuclei (green: CN, cochlear nucleus; blue: IC, inferior colliculus) and a non-auditory control region (red: CPu, caudate putamen). The orientations of sections through each nucleus are also indicated on the schematic sagittal representation of the mouse brain (lower left). (b,c) Quantitative comparison of MEMRI signal between normal mice (n = 7) and bilateral CHL mice (n = 7) in ascending auditory nuclei (CN; IC; MGN, medial geniculate nucleus; AC, auditory cortex; b) and in non-auditory brain regions, including regions with (Cb, cerebellum; Hi, hippocampus; OB, olfactory bulb) and without (CPu) obvious enhancement (c). Regions with statistically significant MEMRI enhancement are marked with an asterisk (*).