
Figure 4.
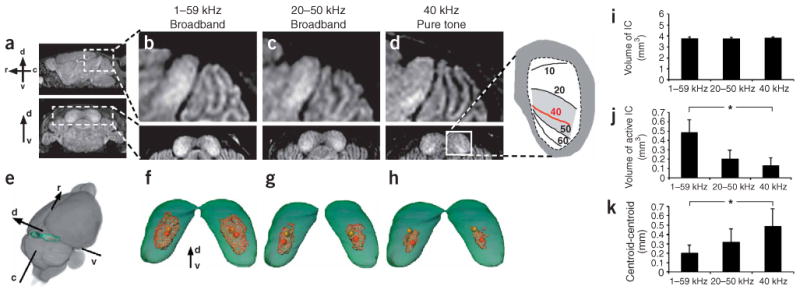
MEMRI was used to map the tonotopic organization of the mouse IC. (a) Sagittal (upper) and coronal (lower) images of the P21 IC showed obvious differences in mice exposed to defined stimuli. (b) After broadband (1–59 kHz) stimulation, enhancement covered most of the rostral-caudal (r-c), ventral-dorsal (v-d) extent of the central nucleus of the IC. (c) After high-frequency broadband (20–50 kHz) stimulation, enhancement was more restricted to the ventral-caudal region. (d) After 40 kHz pure-tone stimulation, enhancement was restricted to an isofrequency band in excellent agreement with electrophysiological maps13 (inset). (e) Averaged, co-registered images (n = 8) were used to extract whole-brain (gray) and IC (green) and to generate 3D maps of MEMRI IC enhancement (red) after stimulation with 1–59 kHz (f), 20–50 kHz (g) and 40 kHz (h). From these 3D maps we determined the spatial coordinates of the centroids of both the IC (yellow spheres) and the enhanced volumes (red spheres). Measurements of IC volume (i), IC-enhanced volume (j), and position (distance between IC centroid and enhanced volume centroid; k) were made in the three experimental groups. Statistical analysis showed significant differences in both the enhanced volumes and the centroid-centroid distances between each pair of groups (*).