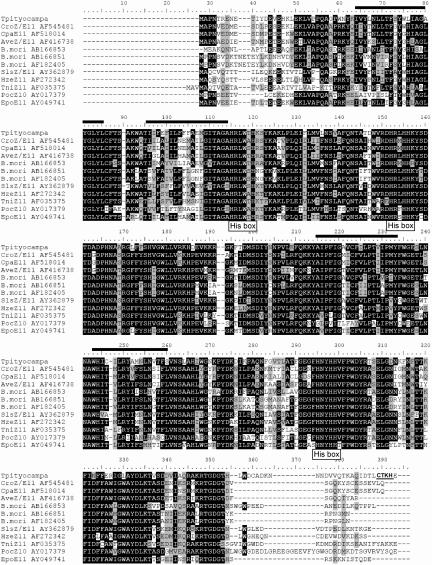
Fig. 2.
Alignment of the predicted protein isolated from T. pityocampa pheromone glands. The alignment was performed with reported sequences (3–9, 24) with the Clustal 1.8 program. The transmembrane domains (http://bioinfo4.limbo.ifm.liu.se/tmap/) are shown with black lines above the sequence, and the endoplasmic reticulum retention signal as proposed by PSORTII tool (www.ExPASy.org) is in bold and underlined (amino acids 289–292). The three His domains are indicated with a “His box” label.

