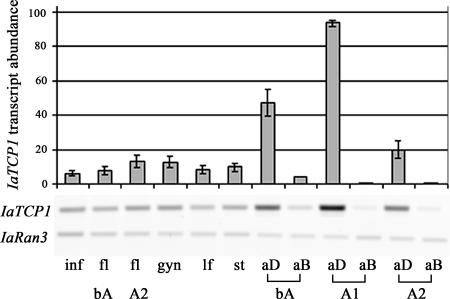
Fig. 2.
RT-PCR analysis of IaTCP1 expression in vegetative and floral organs. (Upper) The graph depicts average IaTCP1 transcript values from three independent reactions, normalized to the expression strength of IaRan3. Error bars indicate standard deviations. IaTCP1 is weakly expressed in leaves (lf) and shoots (st), as well as in inflorescences (inf), flowers before anthesis (fl bA), mature flowers (fl A2), and gynoecia (gyn). A dynamic differential expression becomes apparent in separately analyzed adaxial (aD) and abaxial (aB) petals isolated from flowers before anthesis (bA), from young flowers after anthesis (A1), and from fully mature flowers (A2). Expression is always stronger in adaxial than in abaxial petals. (Lower) Gel image of a representative IaTCP1 and IaRan3 RT-PCR.

