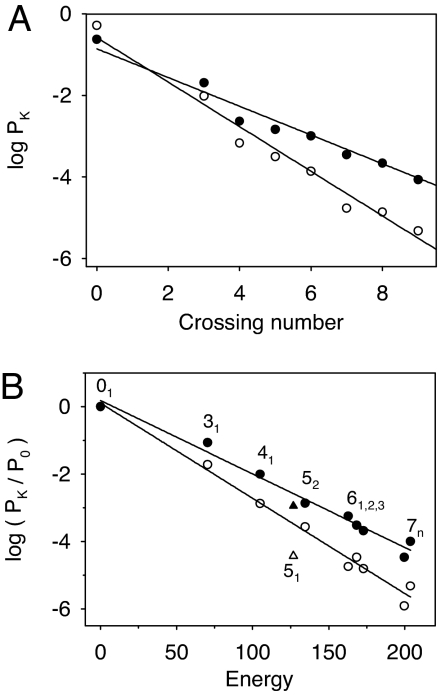
Fig. 5.
Dependence of the probability of knotting on measures of knot complexity. (A) Natural log of PK plotted versus theoretically calculated knot energy (25). (B) Natural log of the probability PK of forming a certain knot plotted vs. minimum crossing number c(K). Each value was normalized by the probability P0 of forming the unknot. The filled circles are results with string lengths L > 1.5 m and the open circles are with L < = 1.5 m. The point styles are as in A except that the results with the 51 knot, which notably did not follow the overall trend, were plotted as triangles.

