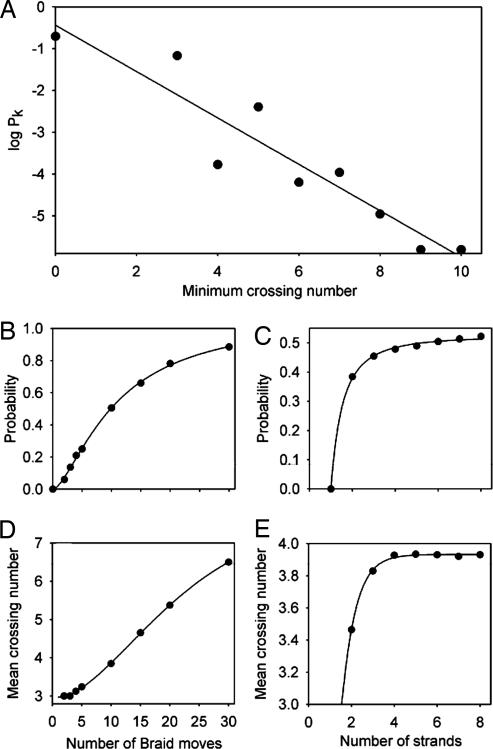
Fig. 7.
Predictions of the random braid move model discussed in the text. An ensemble of 1,000 conformations were generated for each condition and analyzed. (A) Distribution of minimum crossing numbers of knots generated with NS = 10 and NM = 10, where PK is the probability of forming a knot with minimum crossing number c(K). (B) Probability of knotting P vs. number of random braid moves (NM) (proportional to agitation time) for NS = 10 segments (proportional to length). (C) P vs. NS for NM = 10. (D) Average minimum crossing number 〈c(K)〉 vs. NM for NS = 10 segments. (E) 〈c(K)〉 vs. NS for NM = 10.

