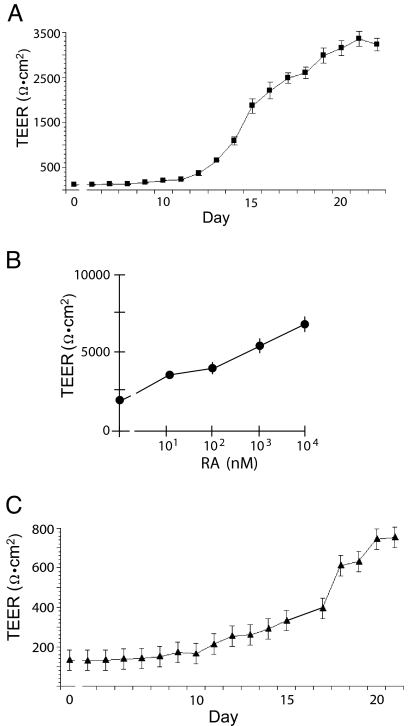
Fig. 3.
TEER measurements of MCF10A cells and mPMEC grown on transwell membranes. Each value is the average of three or four wells (±SEM) of TEER (y axis, note different scales). (A) Typical profile of MCF10A cell membranes. (B) Concentration-response curve (molar:log10) for TEER of MCF10A membranes treated for 48 h with all-trans RA. The treatment was started 24 h before predicted peak TEER. (C) TEER profile of mPMEC in lactogenic medium (1 μg·ml−1 PRL and 1 μM dexamethasone).

