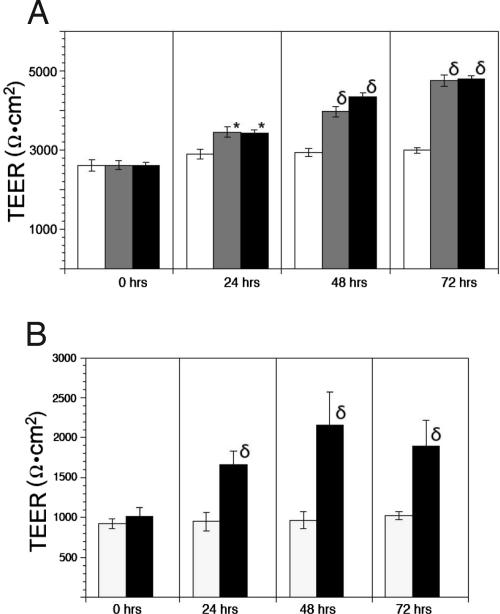
Fig. 4.
Elevation of TEER in response to 5-HT receptor antagonists. Values are graphed as means ± SEM (n = 3) for each measurement time point. Drugs were added at 10 μM concentration after the 0 time point measurement. (A) MCF10A cells treated with growth medium (open columns), MS (shaded columns), or MG (filled columns). (B) mPMEC treated with medium only (open columns) or MG (filled columns). *, P < 0.05 vs. control; δ, P < 0.001 vs. control.

