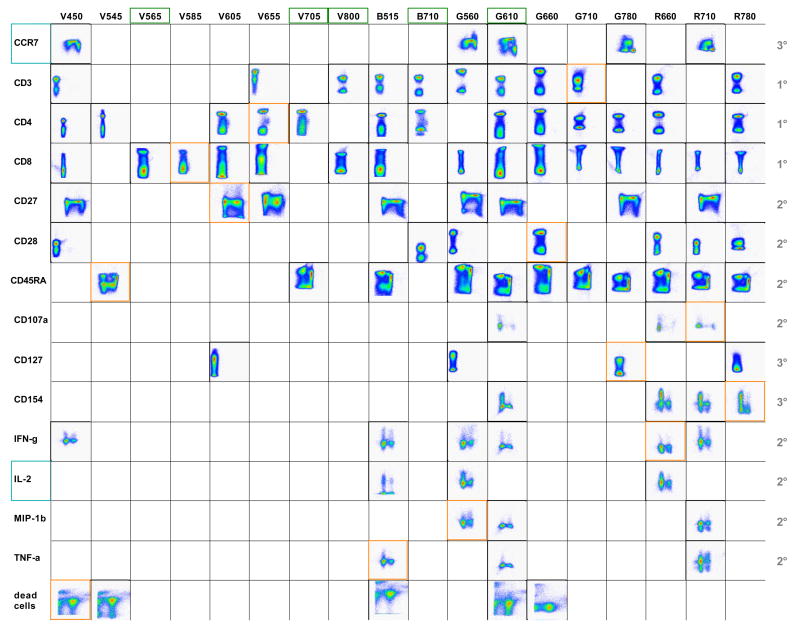
Figure 1. The antigen/detector grid.
The indicated antigens are read on the y-axis. For CCR7 and CD27, CD45RA expression was co-analyzed (x-axis), while for CD45RA, CCR7 was co-analyzed. For CD107a, CD4 expression is shown on the x-axis, while for CD154, IFN-γ, IL-2, MIP-1β and TNF-α, CD8 is illustrated on the x-axis. Orange frames highlight those antibodies included in the antibody panel to be tested, while green frames mark the detectors that are not used in the panel and could potentially be exploited to include further markers in the assay. Blue frames indicate those antigens not included in the selected antibody panel. Numbers on the right hand side of the table indicate primary (1°), secondary (2°) and tertiary (3°) antigens.

