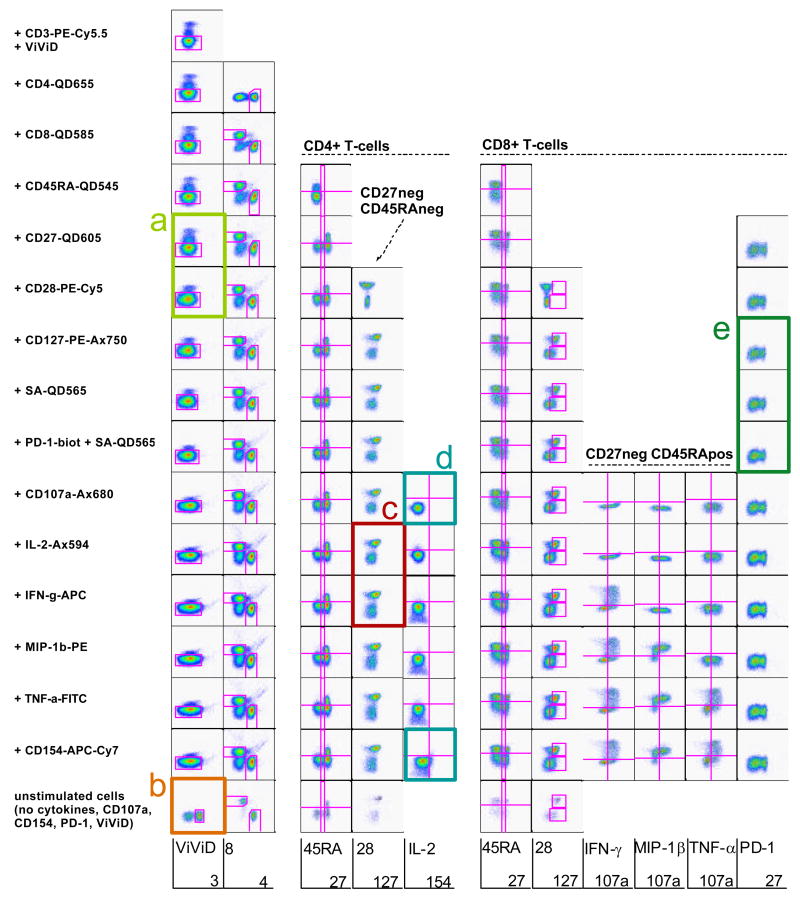
Figure 2. Progressive construction of a multi-colour analysis panel.
In order to determine whether antibody conjugates selected for a multi-colour panel produce signal interference, a series of samples were labelled with subsets of the antibodies making up the panel. The first sample contained one antibody conjugate only (plus ViViD to exclude dead cells), while each subsequent sample contained one more antibody conjugate. Each row depicts plots from a single sample, and the antibody conjugate added at each point is indicated at the left of each respective row. For each sample, dot plots were created that follow the gating strategy to be used during analysis as far as it can be predicted. This allows the identification of antibody conjugates that create signal interferences with other antibody conjugates or simply do not result in sufficient detection sensitivity in the present antibody combination.

