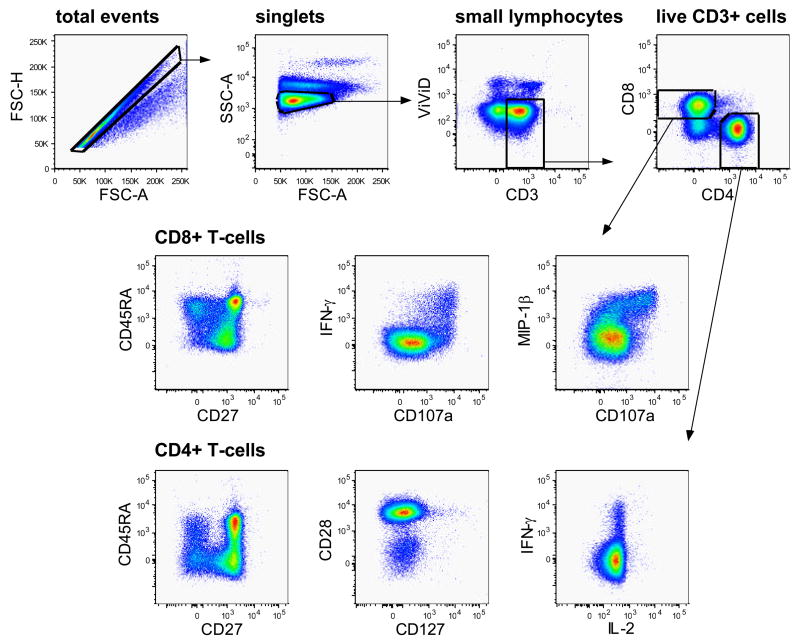
Figure 6. Gating strategy.
The sequential gating strategy applied for the analysis of CD4+ and CD8+ T-cell responses is illustrated by the gates and arrows. Healthy donor PBMC were incubated with anti-CD3 and anti-CD28 antibodies in the presence of CD107aAx680 and monensin.
Note that CD3 molecules were visualized by intracellular labelling. After gating on single-cells, analysis was narrowed down on small lymphocytes. Live CD3+ T-cells were identified and further subdivided into CD4+ and CD8+ T-cells. These were subsequently analyzed for activation markers and cytokines of interest. Some pseudo-colour plots for possible antigen combinations are illustrated.

