
Fig. 4.
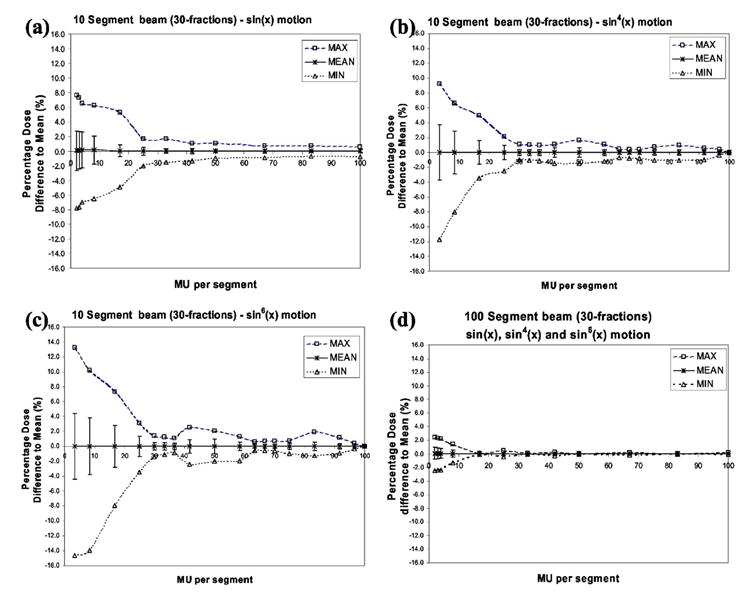
Simulated data of a dose point in the penumbra region of the beam for three types of motion: (a) sin(x) (b) sin4(x), and (c) sin6(x) and for a breathing period of 4 s. The point is irradiated with a beam with either 10 or 100 segments of identical MU value. The error bars represent one (1) standard deviation around the mean, corresponding to the 68% confidence level.