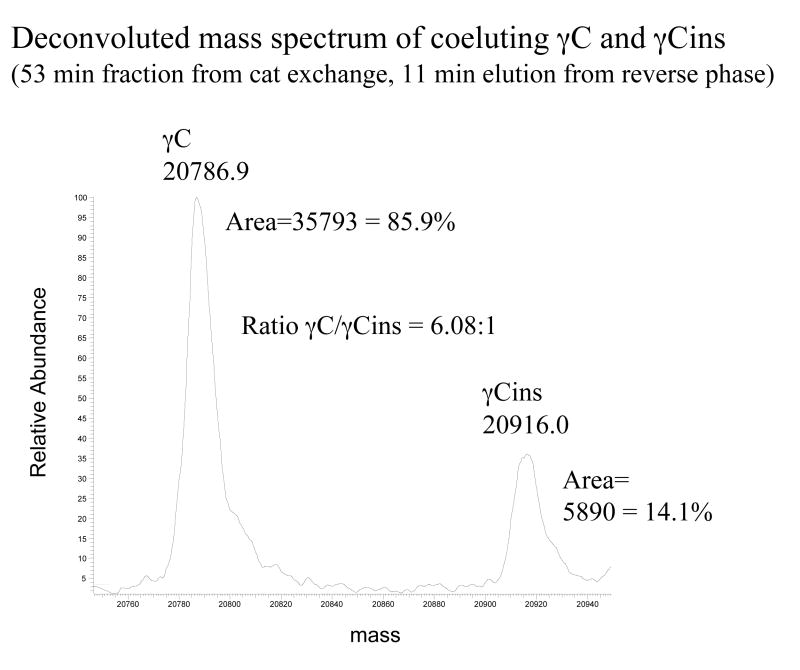
Figure 2.
Relative abundance of γC and γCins in mouse lens. Mouse γCs were copurified by cation exchange chromatography and analyzed by electrospray ionization mass spectrometry during their coelution by reverse phase chromatography. The deconvoluted spectrum was then used to estimate the relative abundance of the two forms of mouse γC by integration of the areas for each protein species.

