
Figure 5. Distance across domain-domain interface.
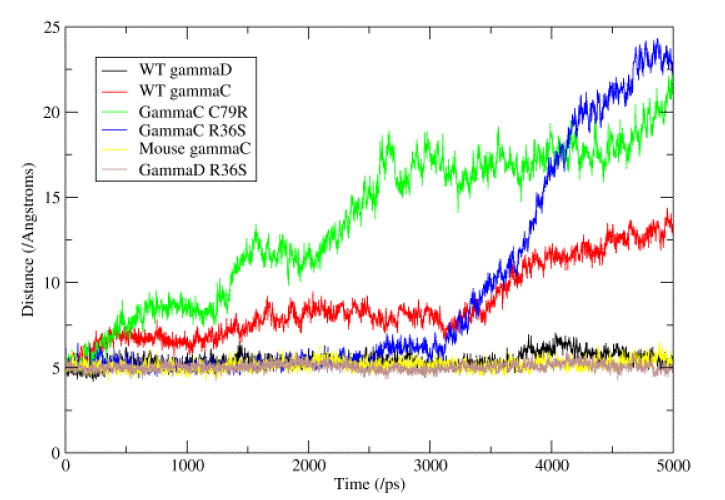
This figure represents the changes seen in the hydrophobic interface between the N- and C-terminal domains. This interface consists of six conserved residues (Met 43, Phe/Leu 56 and Ile 81 from the N-terminal domain and Val 131, Ile 144 and Val 169 from the C-terminal domain). The graph shows the distance between the Cβ atoms of residues Met 43 and Leu 144, these two residues being the most ‘central’ in the interface. It can be seen that the three proteins with a Phe at position 56 show very little change, whilst the three proteins with a Leu at position 56 show a great increase in the distance.