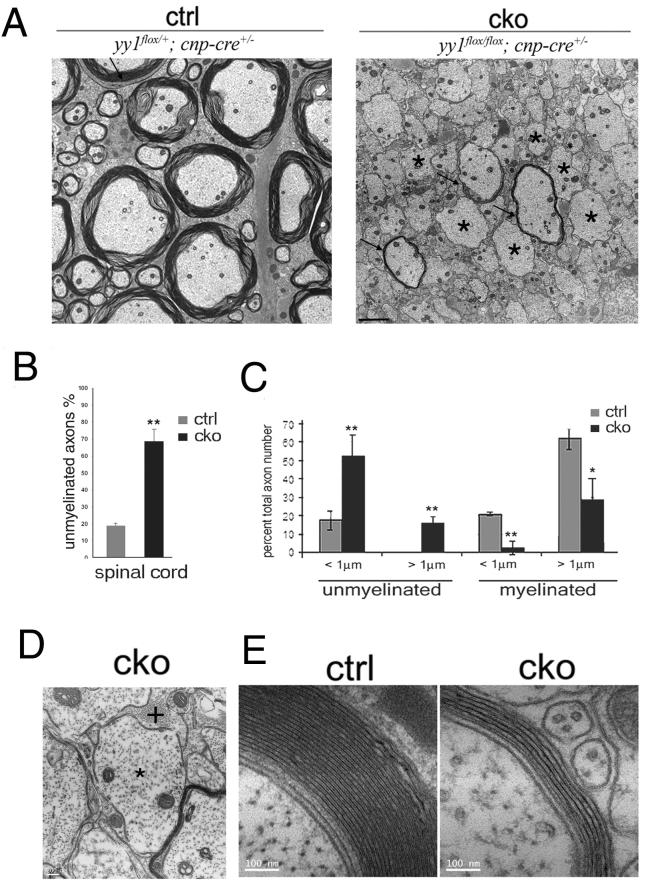
Figure 2. Defective myelination in the spinal cord of yy1 conditional knockout mice.
(A) Ultrastructural analysis of spinal cord sections shows lack of myelin (asterisks) and thinner myelin sheaths (arrows) in p18 yy1 cko mice compared to controls. Scale bar= 2 μm. (B) Bar graph shows increased % of unmyelinated axons relative to total number of axons in the spinal cord of yy1 cko mice (black) compared to controls (gray). (C) Bar graph shows the relative distribution of unmyelinated and myelinated axons in relation to axonal diameter in the spinal cord of yy1 cko mice (black) and controls (gray) at p18 *p<0.05; **p<0.01. (D) Representative EM picture of a large yy1 cko spinal cord axon (diameter >1.5μm) that lacks myelin (*) and is in contact with an astrocytic process (+). Scale bar = 200 nm. (E) Representative EM pictures of myelinated axons of equivalent diameter in control and yy1 cko siblings. Scale bar = 100nm.

