
Figure 4. VEGF-induced Vav2 tyrosine phosphorylation is regulated by Src.

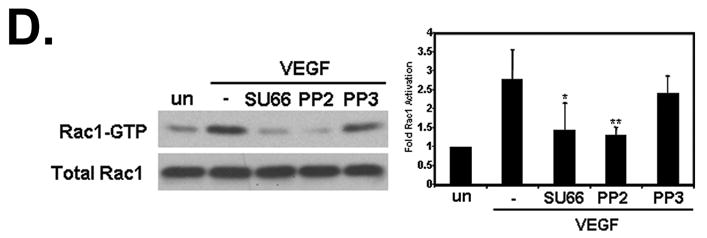
(A) Serum-starved HUVECs were pretreated with either 30 μM PP2 (Src inhibitor) or PP3 (the inactive analog) for 30 min at 37°C and then treated with VEGF. Untreated (un) denotes cells not treated with 10 ng/mL VEGF for 30 min. Lysates were immunoblotted for phosphorylation of tyrosine 418 on Src and showed that Src is catalytically activated after VEGF treatment (upper panel). PP2, but not the control compound PP3, blocks Src tyrosine phosphorylation. The middle panel shows equal Src levels in every immunoprecipitation, whereas the lower panel shows equal protein loading in cell lysates. The histogram on the right shows the average Src tyrosine phosphorylation relative to total Src levels in three independent experiments (n = 3; *p < 0.05). (B) Src inhibition blocks Vav2 tyrosine phosphorylation. HUVECs were serum starved and pretreated as described under “A”. Cells were lysed and Vav2 was immunoprecipitated followed by immunoblotting for phosphotyrosine. Inhibiting Src with PP2 prevents Vav2 tyrosine phosphorylation, whereas Vav2 phosphorylation was unaffected by PP3 (upper panel). The middle panel shows equal Vav2 levels in every immunoprecipitation, whereas the lower panel shows equal protein loading in cell lysates. The histogram on the right shows the average Vav2 tyrosine phosphorylation relative to immunoprecipitated Vav2 levels in three independent experiments (n = 3; *p < 0.05). (C) The Src inhibitor PP2 blocks Vav2 phosphorylation specifically on tyrosine 172. Serum-starved HUVECs were pretreated as described under “A”. Phosphorylation of Vav2 on Y172 was analyzed by western blotting using a phospho-epitope-specific antibody. The upper panel shows that inhibition of Src with PP2 prevents phosphorylation at this residue. The middle panel shows equal Vav2 levels in every immunoprecipitation, whereas the lower panel shows equal protein loading in cell lysates. The histogram on the right shows the average Vav2 phosphorylation on tyrosine 172 activation relative to total Vav2 expression in four independent experiments (n = 4; *p < 0.05). (D) VEGF-induced Rac1 activation is regulated by Src activity. HUVECs were serum starved for 1 h, pretreated with either 30 μM PP2 or 5 μM SU6656 (Src inhibitor) or 30 μM PP3 for 30 min at 37°C. Cells were then treated with 10 ng/mL VEGF and subsequently assayed for Rac1 activity as described in Experimental Procedures. The upper left panel shows Rac-GTP levels after VEGF treatment. The lower left panel shows total Rac1 levels. The histogram on the right shows quantification of the increase in Rac1 activity after VEGF stimulation. Data is representative of five independent experiments (n = 5; *p < 0.05, **p < 0.01).