
Figure 5. Vav2 silencing by siRNA reduces HUVEC chemotaxis and wound closure.
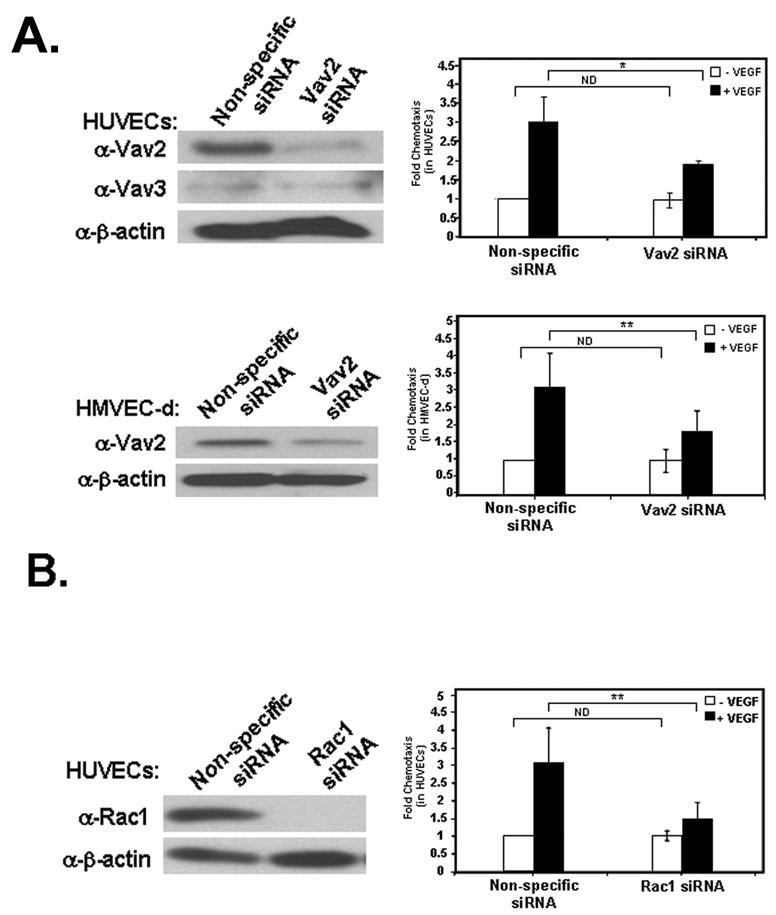

(A) HUVECs (top panels) or HMVEC-d (bottom panels) were transfected with either non-specific control (siGLO) or Vav2-specific siRNA. Blots indicate efficient knockdown of Vav2 protein levels. Cells were allowed to migrate for 4 h towards non-specific control media (open bars) or media containing 10 ng/mL VEGF (closed bars) using Transwell filters. Chemotaxis was quantified by calculating the mean number of cells that had migrated on the underside of the Transwell filter in three separate fields per filter ± standard deviation of triplicate independent experiments (n = 3; ** p < 0.01; *p < 0.05; ND, not significantly different by 2-way ANOVA). (B) Silencing of Rac1 decreases HUVEC migration towards VEGF. HUVECs were transfected with either non-specific control (siGLO) or Rac1-specific siRNA. Blots indicate efficient knockdown of Rac1 protein levels. Cells were allowed to migrate for 4 h towards non-specific control media (open bars) or media containing 10 ng/mL VEGF (closed bars) using Transwell filters. Chemotaxis was quantified by calculating the mean number of cells that had migrated onto the underside of the Transwell filter in three separate fields per filter ± standard deviation of triplicate independent experiments (n = 3; ** p < 0.01; ND, not significantly different by 2-way ANOVA). (C) Knockdown of Vav2 by siRNA prevents VEGF-induced wound closure. Cells transfected with either control siRNA or Vav2-targeting siRNA were wounded with a pipette tip and allowed to invade the wound for 48 h in the presence of 10 ng/mL VEGF. Wound closure was visualized by phase microscopy. The distance of wound closure is the average wound closure on three distinct points on each image over time and divided by the average initial wound size. At least five images were collected at each time point. Bar, 100 μm. The graph shows the mean distance of wound closure in three independent experiments (n = 3; *p < 0.05; ** p < 0.01).