
Figure 2.
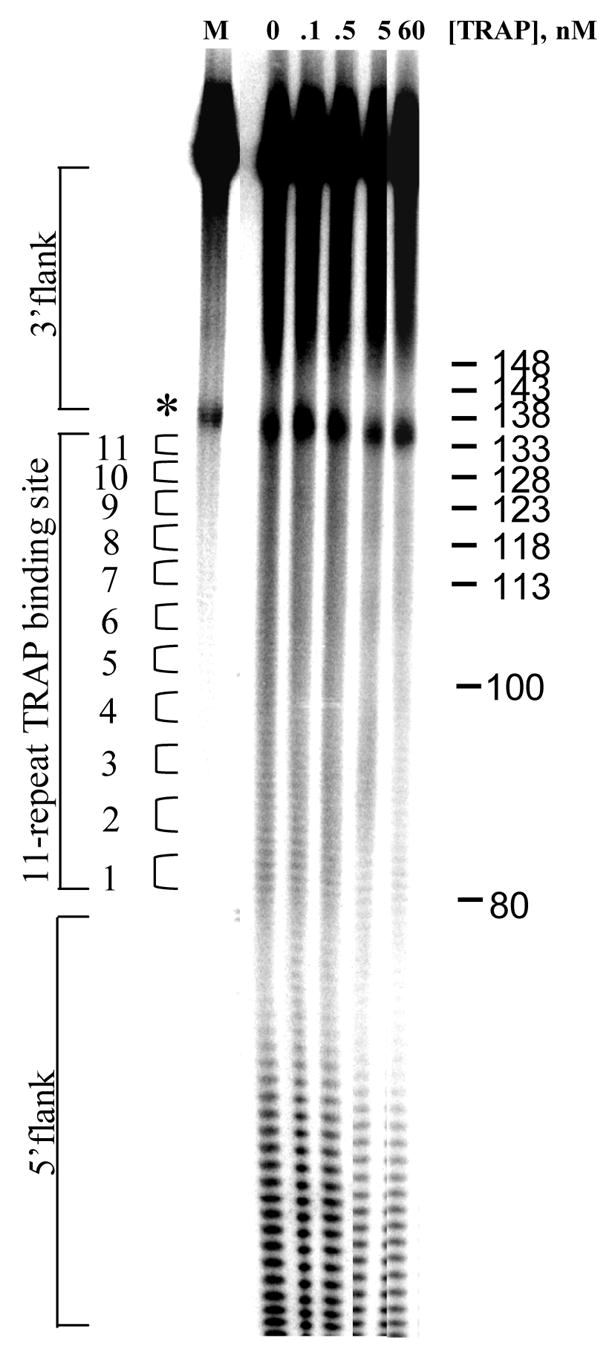
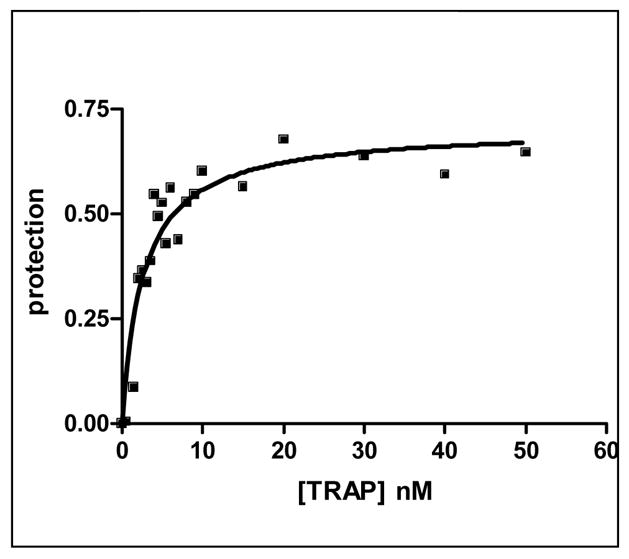
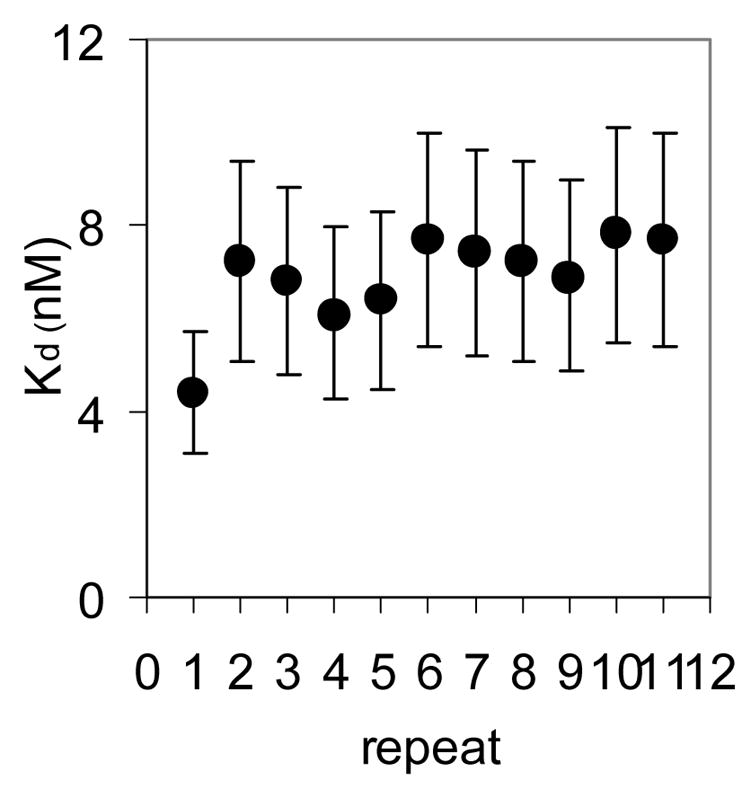
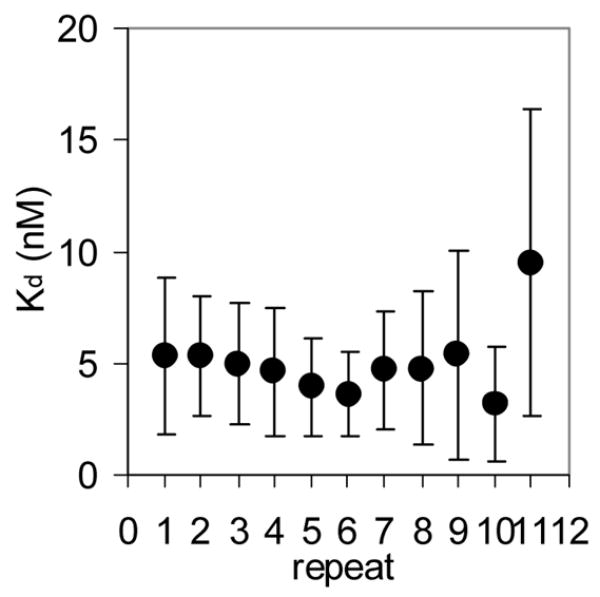
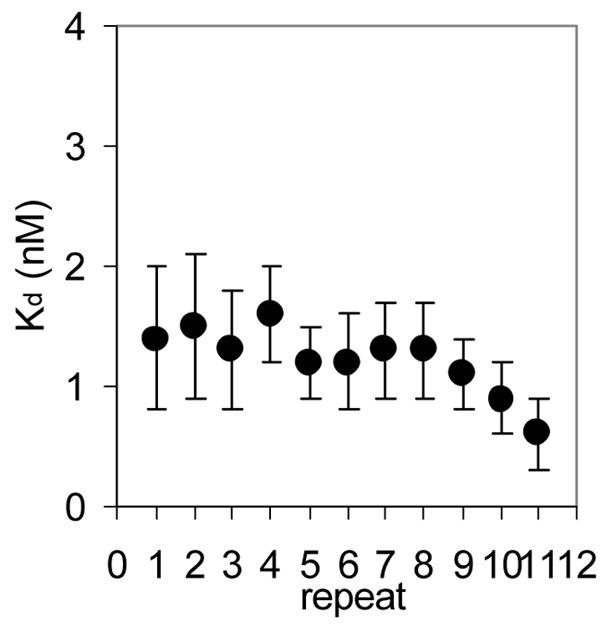
(A) Mung Bean nuclease footprint of (T25A)10WT1 TRAP binding to GAGAU11 RNA (5 pM). The concentration of TRAP was increased from 0 to 60 nM (from the left to the right, lanes marked 0–60). The lane marked “m” is mock-treated control. The position of the TRAP binding site is indicated with a bracket on the left side of the gel with eleven vertical brackets indicating the positions of individual GAG repeats, numbered from the 5′ end. The 5′ flanking and 3′ flanking sequences preceding and following the TRAP binding site are indicated. Positions of MW size markers that were generated by a partial RNase T1 digest of the DNA/RNA chimera “ElevenRiboG”,16 are shown on the right side of the gel. Note that only several representative concentrations of TRAP are shown of the many that were used to generate binding curves (B) Equilibrium binding curve for (T25A)11WT1 hetero-11-mer TRAP binding to (GAGAU)11polyA RNA. Data are the average of seven experiments with standard errors of < 7% of the mean. (C–E) Kd values for TRAP binding to individual repeats numbered 1 to 11 starting at the 5′ most repeat in each binding site in (GAGAU)11polyA RNA determined by protection from Mung Bean nuclease; (T25A)10WT1 TRAP (C), (R58A)10WT TRAP (D), WT TRAP (E). Data for WT TRAP were published previously16 and are shown here for comparison.