
Figure 11.
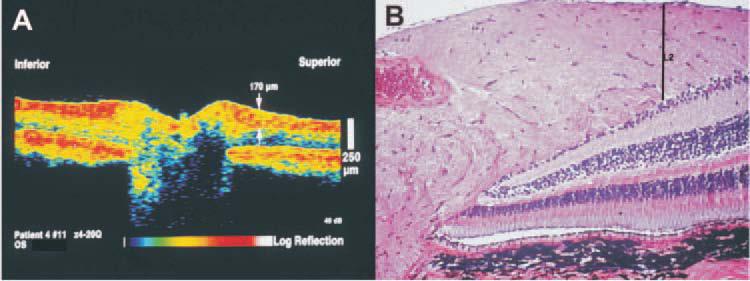
(A) OCT image of a control monkey eye. The arrow indicates the location of the RNFL thickness measurement of 170 μm at a single measuring point out of the 100 points obtained in each OCT circumpapillary scan. (B) Histologic section of the same eye; the line labeled L2 indicates the same tissue location measured in the OCT. Scale bars, 250 μm.