

Abstract
Increasing the number of channels at low frequencies improves discrimination of fundamental frequency (F0) in cochlear implants [Geurts and Wouters 2004]. We conducted three experiments to test whether improved F0 discrimination can be translated into increased speech intelligibility in noise in a cochlear implant simulation. The first experiment measured F0 discrimination and speech intelligibility in quiet as a function of channel density over different frequency regions. The results from this experiment showed a tradeoff in performance between F0 discrimination and speech intelligibility with a limited number of channels. The second experiment tested whether improved F0 discrimination and optimizing this tradeoff could improve speech performance with a competing talker. However, improved F0 discrimination did not improve speech intelligibility in noise. The third experiment identified the critical number of channels needed at low frequencies to improve speech intelligibility in noise. The result showed that, while 16 channels below 500 Hz were needed to observe any improvement in speech intelligibility in noise, even 32 channels did not achieve normal performance. Theoretically, these results suggest that without accurate spectral coding, F0 discrimination and speech perception in noise are two independent processes. Practically, the present results illustrate the need to increase the number of independent channels in cochlear implants.
Keywords: Speech in Noise, Segregation, Vocoder, Spectral Resolution
I. INTRODUCTION
Cochlear implants have successfully restored partial hearing to over 100,000 deaf persons worldwide. Users of modern cochlear implants generally perform well in quiet listening conditions with good users being able to communicate on the telephone. However, these individuals still perform poorly in speech recognition in noise, music appreciation, speaker identification, and tonal language perception.
Current cochlear implants have a very limited number of effective frequency channels, leading to poor pitch perception and speech recognition in noise (Fu et al. 1998; Qin and Oxenham 2003; Stickney et al. 2004). Voice pitch, corresponding to the fundamental frequency (F0), has been shown to be a critical cue for segregating multiple voice streams. For example, normal hearing listeners can identify speech in the presence of a competing talker more accurately, when there is a greater difference in F0 between the two talkers (Brokx and Nooteboom 1982).
The F0 is coded in normal hearing by both the place of excitation on the basilar membrane and the temporal coding of the neurons. In cochlear implants, these cues are much more limited. Place coding of pitch is degraded by the limited number of electrodes, resulting in a coarse frequency representation and an impaired ability to resolve harmonics. While available, the temporal envelope cue that arises from modulations of the carrier due to multiple unresolved harmonics generally provides a weak pitch percept (Burns and Viemeister 1976, 1981).
To enhance the utility of the place coding of pitch in cochlear implants, Geurts and Wouters (2004) suggested that the number of channels at low frequencies be increased to improve F0 discriminability. Their filter bank had approximately four and a half channels below 500 Hz as compared with a model based on the Greenwood map, which with the parameters used, had only two channels in this region (Greenwood 1990). Indeed, the new filter bank improved F0 discrimination. Along the same line, Leigh, Henshall, and McKay (2004) added two or three extra channels below 2.6 kHz in the clinical map of Nucleus-22 implant users and found an increase in the transfer of vowel first formant information. However, they found that this increase in channel density actually produced a decrease in word recognition. In a cochlear-implant simulation, Qin and Oxenham (2005) evaluated F0 discrimination with up to 40 channels but evaluated F0 segregation with 24 channels. They showed no benefit to segregation with 24 channels over 8 channels. As of yet, improved F0 discrimination associated with increased channel density has not been directly linked to improved functional benefit such as speech perception in noise.
Others have chosen to enhance the temporal coding of pitch. McKay, McDermott and Clark (1994) showed that implant subjects could follow the pitch of a sinusoidally amplitude-modulated pulsatile carrier up to a few hundred Hertz. Geurts and Wouters (2001) observed that enhanced representation of the temporal envelope improved F0 discrimination of synthetic vowels. Laneau, Wouters and Moonen (2006) then showed that enhancing the envelope modulation improves recognition of musical notes and melodies. Enhancing the temporal cue also improved identification of questions versus statements (Green et al. 2005). For tonal languages, such as Mandarin Chinese, the temporal envelope cue has been shown to contribute to speech recognition (Fu et al. 1998; Luo and Fu 2004). It remains unknown whether these observed benefits with improved coding of temporal cues would improve speech recognition in noise.
Surprising results have come from recent implantation of patients with significant residual low frequency hearing, which allows for explicit preservation of F0, and potentially some F1 or F2 information (von Ilberg et al. 1999). Both simulated (Dorman et al. 2005; Chang et al. 2006) and actual hybrid hearing studies (Turner et al. 2004; Kong et al. 2005) have shown that the addition of low frequency acoustic information significantly improved speech performance in noise, particularly when the noise was a competing voice.
The present study focuses on the relative contribution of spectral and temporal cues to F0 discrimination and speech intelligibility. Experiment 1 uses four frequency-resolution models to investigate the effect of spectral resolution in different frequency regions on F0 discrimination and speech intelligibility in quiet. Experiment 2 investigates whether improved F0 discrimination can lead to increased speech recognition with a competing voice. Experiment 3 attempts to find the minimum number of channels required at low frequencies to achieve normal performance in speech recognition in noise.
II. EXPERIMENT 1
A. Methods
1. Subjects
Eight normal-hearing subjects, aged 20 to 38 years, 6 females and 2 males, participated in this study. The Institutional Review Board approved all experimental procedures. Informed consent was obtained from each subject. None of the subjects reported any speech or hearing impairment. All subjects were native English speakers and were compensated for their participation.
2. Stimuli
Filter bank configurations
Figure 1 shows four 8-channel, pure-tone vocoder models used in this experiment. Frequency is plotted on a logarithmic scale. Fourth order Butterworth filters were used for both the high-pass and low-pass elements of the band-pass filters in each model. The first model selected cutoff frequencies based on the Greenwood basilar membrane place map (Greenwood, 1990). The Greenwood model had cutoff frequencies at 100, 219, 392, 643, 1006, 1532, 2294, 3399, and 5000 Hz. The other three models used 6 channels to enhance spectral resolution in the low- (100–500 Hz), middle- (500–1500 Hz), and high-frequency (1500–5000 Hz) regions, respectively, while using 2 channels to cover the remaining frequency range. These models are referred to as the “Low”, “Middle”, and “High” model, through the remainder of the paper. Filter cutoff frequencies were spaced linearly below 1000 Hz and logarithmically above 1000 Hz, producing the cutoff frequencies for the Low model at 100, 167, 233, 300, 367, 433, 500, 1500, and 5000 Hz. The Middle model cutoff frequencies were at 100, 500, 667, 833, 1000, 1145, 1310, 1500, and 5000 Hz. The High model cutoff frequencies were at 100, 500, 1500, 1833, 2240, 2738, 3346, 4089, and 5000 Hz. The Low model was chosen to provide better spectral coding of the F0. The Middle model provides for a better representation of vowel formants. The High model uses broad filters to enhance the F0 representation in temporal modulation due to an increased number of harmonics in each band.
Figure 1.

Filter bank designs for the four models. All filters are fourth order Butterworth filters.
Signals were first passed through the band-pass filters. Each sub-band was then full-wave rectified and low-pass filtered to extract the envelope. Full-wave rectification was chosen instead of half-wave rectification because it more accurately represents the slowly-varying temporal envelope important for speech (Nie et al. 2006). While full-wave rectification doubles the carrier frequency, it does not affect temporal envelope frequencies. For example, a 100-Hz sine wave when full-wave rectified will have a frequency of 200 Hz, but a 100-Hz sinusoidally amplitude modulated tone or a saw tooth will have a modulation rate of 100-Hz after full-wave rectification. The sub-band envelope was extracted by low-passing at frequencies of 500, 160, or 50 Hz with an 8th order Butterworth filter. The 500-Hz low-pass will allow for the most temporal envelope information including the F0 and possibly first few harmonics. The 160-Hz low-pass will allow only the F0. The 50-Hz low-pass will exclude any pitch related temporal information. The sub-band envelope was then used to modulate a pure tone at the center of each frequency band (Shannon et al. 1995; Dorman et al. 1997). A pure tone carrier, rather than a noise carrier, was used to simulate the cochlear implant users’ better than normal performance in temporal modulation detection (Shannon 1993; Kohlrausch et al. 2000; Zeng 2004). Finally, the output of the modulated sub-band signal was passed through the original analysis filter to remove any sidebands induced by the modulation that exceed the channel width. All frequency bands were summed to produce the acoustic simulation of the cochlear implant.
Fundamental Frequency Discrimination
F0 discrimination was measured with a single sentence “Hoist the Load” selected from the IEEE Sentence list (Rothauser et al. 1969). The sentence’s original F0 had a mean of 122 Hz plus or minus 14 Hz. F0 was upward shifted using the STRAIGHT Program (Kawahara et al. 1999) from 1 to 24 semitones in 1-semitone steps. Formants were not changed in the process, but with large F0 shifts, the number of harmonics available to accurately code the formant position would be decreased.
Speech Intelligibility
Intelligibility was measured with IEEE Sentences, 20 /aCa/ consonants (Shannon et al. 1999), and 11 /hVd/ vowels (Hillenbrand et al. 1995) recorded from one male talker. The IEEE Sentences are a set of seventy-two phonetically balanced lists, with each list having ten sentences and each sentence containing five target words. For vowels, only 11 of the 12 Hillenbrand vowels were used due to similarity between ‘hawed’ and ‘hod’ in the California dialect (Whalen et al. 2004). Because most of the subjects were native Californians, ‘hod’ was eliminated in the test. All stimuli were presented monaurally at an average level of 70 dB SPL through Sennheiser HDA 200 Audiometric headphones. This level was verified by a Brüel & Kjaer Type 2260 Modular Precision Sound Analyzer coupled to an artificial ear.
3. Procedure
Fundamental Frequency Discrimination
F0 discrimination was measured using a 2-interval, 2-alternative forced choice task with a 3-down, 1-up decision rule, corresponding to the 79.4 % correct value on the psychometric function (Levitt 1971). The single sentence was presented with two different F0s; one was always at the original value, the other was shifted higher. Subjects were instructed to choose the sentence that was higher in pitch. The F0 difference between the two sentences began at 24 semitones and was adjusted by 4 semitones per step for the first four reversals and 1 semitone per step for the next 9 reversals. The difference limen was determined as the mean of the last 8 reversals. Four models and 3 envelope low-pass conditions were tested resulting in 12 test conditions plus an unprocessed control condition. All conditions were randomized and tested three times per subject. A short practice was given on the unprocessed condition to familiarize the subject with the procedure.
Speech Intelligibility
For sentence intelligibility measures, two lists of IEEE sentences were selected randomly from 72 possible lists and were presented for each condition. Intelligibility was determined as the percentage of target words correctly typed by a subject after hearing the sentence. Lists and presentation order of models were fully randomized. Subjects were given no practice or feedback. Vowels and consonants were tested using a graphic user interface where subjects clicked on the appropriate phoneme. Each vowel or consonant for each model was presented three times and all phonemes within a particular model were randomized. Subjects were given no practice or feedback.
All subjects were tested on all conditions to allow a within-subjects design in data analysis. The F0 discrimination data were analyzed using a two factor repeated measures analysis of variance (ANOVA) with filter bank model and the envelope low-pass frequency as the independent variables. The intelligibility data were analyzed using a one-factor ANOVA with the filter bank model as the independent variable.
B. Results and discussion
Fundamental Frequency Discrimination
Figure 2 shows F0 discrimination results. The y-axis represents the average number of semitones in F0 discrimination as a function of filter bank density for the 50, 160, and 500 Hz envelope low-pass frequencies, respectively (top, middle, and bottom panels). Error bars represent the standard error of the mean. The horizontal solid line represents the mean, while the two dashed lines represent plus and minus one standard error of the mean, for F0 discrimination with the unprocessed original sentence. On average, normal-hearing subjects can discriminate an F0 shift of 1 semitone using the unprocessed sentence.
Figure 2.

Data for Exp. 1. F0 discrimination values for the four filter bank models with three different envelope low-pass frequencies. Error bars indicate the standard error of the mean. The horizontal lines are the mean for the unprocessed condition with the dashed lines representing the standard error of the mean. (* indicates p<0.05)
A main effect was seen for both the filter bank model [F(3,21)=13.5, p<0.05] and the envelope low-pass frequency [F(2,14)=18.3, p<0.05]. Two-tailed paired-samples Student’s t-tests show that the Low filter model yielded significantly better discrimination (p<0.05) than the Greenwood filters, by an average of 3.6 semitones for the 50 Hz, 2.6 semitones for the 160 Hz, and 1.8 semitones for the 500 Hz low-pass conditions. The High filter model also produced significantly better discrimination (p<0.05) but only for the 160 and 500 Hz low-pass conditions. The Middle filter model produced similar performance to the Greenwood model.
The present results indicate that both spectral and temporal cues contributed to F0 discrimination. Accurate representation of spectral cues is proportional to the channel density, but that of temporal envelope cues is proportional to the width of each filter after modulation. Because the Low model offered three times as many channels below 500 Hz as the Greenwood model, it is expected to produce better performance in F0 discrimination due to explicit enhancement of spectral cues. The better performance with the 160 and 500 Hz conditions in the High model was likely a result of the utilization of the temporal envelope cues. This interpretation is supported by the poor F0 discrimination with the 50 Hz low-pass envelope in the High model. An alternative interpretation is that the better performance with the 160 and 500 Hz low-pass over the 50 Hz low-pass in the High model is from listening to the resolved spectral sidebands. However, this interpretation is less likely because the condition with a higher F0 would have a higher modulation rate in each channel resulting in an upper sideband with a higher pitch, but a lower sideband with a proportionally lower pitch as well. Improved performance would require the consistent attention to the upper sideband only. Due to the upward spread of masking, the effect of the lowest sideband would be greatest resulting in, potentially, an overall lower pitch (Wegel and Lane 1924). Conversely, if a centroid model is used, the perceived pitch of this overall complex would be unchanged (Anantharaman et al. 1993). The Middle model has a decreased spectral resolution but potentially a slightly increased temporal component due to the two broader filters. This yields performance comparable to the Greenwood control. Overall, the present result confirmed previous findings that increased channel density at low frequencies can significantly improve F0 discrimination. How the channel density affects speech intelligibility will be evaluated in the next section.
Speech Intelligibility
Figure 3 shows the intelligibility of IEEE Sentences, /hVd/ vowels, and /aCa/ consonants for each of the four models. The intelligibility results were obtained with only the 500 Hz low-pass condition so as not to limit performance due to a lack of temporal envelope cues. Error bars represent the standard error of the mean.
Figure 3.

Data for Exp. 1. Percent correct scores for the four filter bank models on IEEE sentences, vowels, and consonants. Error bars indicate the standard error of the mean. (* indicates p<0.05)
A main effect of the filter models was observed for sentences [F(3,18)=22.5, p<0.05], vowels [F(3,18)=15.2, p<0.05], and consonants [F(3,18)=24.7, p<0.05]. Opposite to the F0 discrimination results, the Low filter model produced significantly lower intelligibility than the Greenwood model, by 59 percentage points for sentences, 24 percentage points for consonants, and 21 percentage points for vowels (p<0.05). The Middle filter model produced similar performance in vowel and consonant recognition, but 25 percentage points lower performance in sentence recognition than the Greenwood model (p<0.05). The reason for this discrepancy between phonemic and sentence recognition is unclear. The High filter model produced significantly lower performance than the Greenwood model by 20 percentage points for sentences and 12 percentage points for vowels (p<0.05), but similar performance for consonants.
The present data suggest a general encoding dilemma between F0 discrimination and speech intelligibility when spectral cues are used to transmit F0 information. This dilemma is best exemplified by the Low filter model, which produced good performance in F0 discrimination but poor performance in speech intelligibility. An optimizing tradeoff is needed to address this dilemma. One approach would be to compromise the number of channels between low and high frequencies. Since the tradeoff is less when F0 information is presented temporally, as in the High model, a second approach would be to increase the temporal envelope frequencies (e.g., 500 Hz) to sufficiently pass the F0 and possibly first few harmonics while maintaining the channel density required to support speech intelligibility at middle and high frequencies. This approach has received some support from improved cochlear implant performance with the Hilbert envelope and increased cutoff frequency in envelope extraction (Nie et al. 2005). This function of envelope low-pass was also demonstrated by Xu et al. (2002) who showed that Mandarin Chinese tone recognition improved in a single channel with a cutoff frequency of up to 256 Hz. Exp. 2 will evaluate the potential utility of both approaches in real-world listening tasks, such as speech recognition with a competing voice.
III. EXPERIMENT 2
A. Methods
1. Subjects
Nineteen normal-hearing subjects were recruited from the same subject pool as Exp. 1. They were 19 to 52 years old, and included 12 females and 7 males.
2. Stimuli
The Greenwood filter model was used again as the control. To test the effectiveness of the filter optimization, a new Low Model was developed. Figure 4 shows the new Low model, which has only four channels between 100 and 500 Hz, instead of six channels as in Exp. 1. Each of the four filters is 100 Hz wide. Consequently, this new model will be referred to as Low-4 to distinguish it from the Low model in Exp. 1. The envelopes in the Greenwood and Low-4 models were low-passed by an 8th order Butterworth filter with a 160 Hz cutoff to allow the F0 but no additional cues. To test the utility of temporal cues, the High filter model with a 500-Hz envelope cutoff frequency from Exp. 1 was used to maximize the transmission of temporal envelope information.
Figure 4.
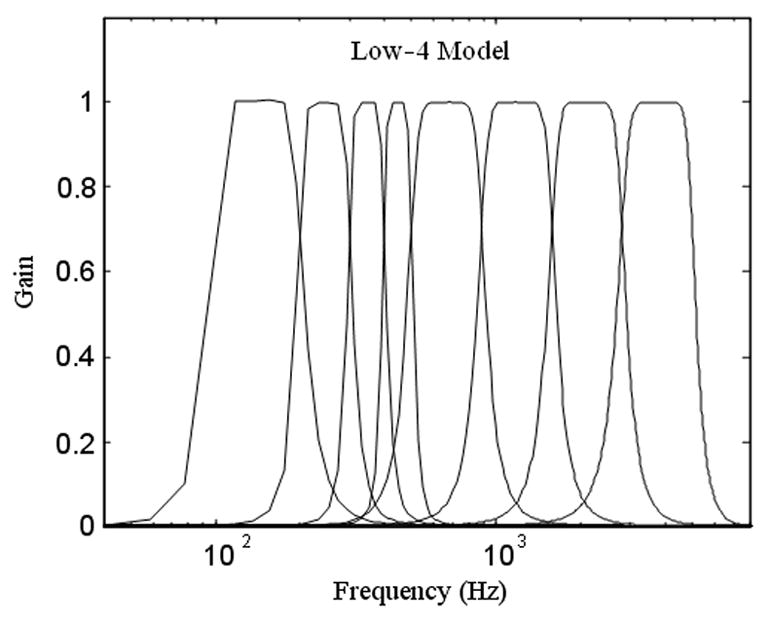
Filter bank design for the Low-4 model for Exp. 2. This filter bank increases F0 resolution while minimizing loss of intelligibility.
The Low-4 model still provides twice the low frequency resolution of the Greenwood model. Five of the 8 subjects who participated in Exp. 1 were tested on the same F0 discrimination task with this new model (the other 3 subjects were not available for testing). The subjects could discriminate an F0 difference of 3.1 semitones +/− 1.0 semitones, which was better than the Greenwood model (6.0 +/− 1.7 semitones for the same 5 subjects; p=0.05) but was significantly worse than the Low model from Exp. 1 (1.5 +/− 0.4 semitones for the five subjects, p<0.05). However, it serves as a compromise between F0 discrimination and speech intelligibility.
IEEE Sentences were presented concurrently with a competing voice. The competing voice was always a male voice speaking the sentence “It snowed, rained, and hailed the same morning.” The masker has an F0 of 107 plus or minus 30 Hz. This sentence was shifted up in F0 using the STRAIGHT program by 0, 4 or 8 semitones. The target sentences were drawn from the IEEE sentence lists and had original F0. The sentences as a set have a mean F0 of 103 plus or minus 29 Hz. The target and masker sentences were spoken by the same male. The sentences were tested at signal to noise ratios (SNRs) of +20, +10, 0, −10 and −20 dB, as well as in quiet.
3. Procedure
Subjects were asked to type the target sentence while ignoring the competing voice. The quiet condition was always presented first to allow subjects to familiarize themselves with the task. The five signal-to-noise ratios were then presented in random order. One list of ten sentences was randomly selected from the IEEE set and presented for each condition and all six signal-to-noise ratios were presented for a given F0 shift of the masker. The three F0 shifted conditions were presented in random order and all three conditions were tested consecutively for each model. The Greenwood, Low-4, and High models were presented in random order. The results were recorded as the percent correct scores in response to keywords in the sentences. A total of 540 sentences were presented (3 models x 3 F0 shifts x 6 SNRs x 10 sentences per condition). A within subjects design was used. The data were analyzed using a three factor repeated measures ANOVA, with the filter model, F0 difference, and signal-to-noise ratio as the independent variables.
B. Results and discussion
Figure 5 shows percent correct scores as a function of F0 difference at different SNRs (different symbols) and for the three models (panels). The gray shaded region represents the mean plus or minus one standard deviation for unprocessed speech at 0 dB SNR which were collected using identical stimuli and methods (Stickney et al., submitted). These unprocessed data showed clearly improved performance with greater separation in F0 between the target and the masker, from 71% +/− 4% with identical F0 to 76% +/− 5% with 3-semitone difference and a plateau in performance at 82% +/− 2.5% and 83% +/− 3% with 6- and 9-semitone differences, respectively.
Figure 5.
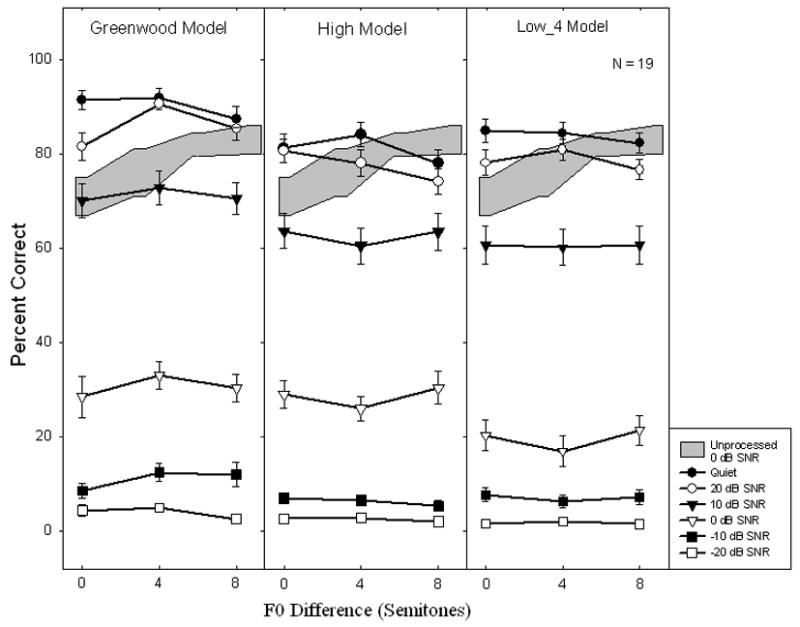
Data for Exp. 2. Percent correct scores for a speech with a competing talker task. Data are shown for three filter bank models, six signal to noise ratios, and three differences between F0 for the target and the masker. Error bars indicate the standard error of the mean. In cases where no error bars are visible, the error is smaller than the symbol size. The gray region shows data for an unprocessed condition with a 0 dB signal to noise ratio.
Recall that both the High filter and the Low-4 filter models produced better F0 discrimination than the Greenwood filter control by 1.4 semitones (average from all 8 subjects in Exp. 1) and 2.9 semitones (average from the 5 available subjects), respectively. Given the results from Exp. 1, we would not necessarily predict better overall performance. We would, however, predict that performance with the experimental models would improve as a function of the F0 difference between the target and masker. However, no significant main effect was found for the F0 difference [F(2,36)=1.2, p=0.32].
A significant main effect was found for both the filter model [F(2,36)=18.3, p<0.05] and SNR [F(5,90)=975.8, p<0.05] as well as an interaction between the model and SNR [F(10,180)=4.5, p<0.05]. The effect of the model was demonstrated in Exp. 1 for the Greenwood and High models with the Greenwood model producing significantly better performance in sentence recognition in quiet. While the Low-4 model yielded better intelligibility than the Low model from Exp.1 for sentences in quiet, this performance did not reach the performance level of the Greenwood model. Due to the interaction between the model and SNR variables, a pair-wise ANOVA analysis of models was performed to confirm the results. The Greenwood model showed significantly higher scores than either the High or Low-4 models [F(1,18)=24.3, p<0.05] and [F(1,18)=32.8, 9<0.05], respectively. There was no significant difference between the High and Low-4 models [F(1,18)=0.9, p=0.37].
The present results indicated that both the High and Low-4 filter models could improve F0 discrimination over the Greenwood control, but neither provides any measurable improvement in speech perception with a competing voice. This suggests that improvement of F0 discrimination with either a temporal envelope cue, derived from a high envelope low-pass, or increasing the number of low frequency channels does not provide sufficient information to understand speech with a competing talker. This experiment, however, limits the scope to an 8-channel simulation. Given that current cochlear implants have up to 22 electrodes and future implants may have even more, we would like to find out how many spectral channels are needed to support normal performance in speech recognition in noise. Exp. 3 will explicitly address this issue.
IV. EXPERIMENT 3
A. Methods
1. Subjects
Seventeen of the 19 subjects from Exp. 2 participated in this experiment. They were 19 to 38 years old, and included 12 females and 5 males.
2. Stimuli
Figure 6 shows the filters for the 6 models used in this experiment. All 6 models had four channels spanning 500 to 5000 Hz to simulate a 4-channel cochlear implant. The cutoff frequencies were 500 Hz, 945 Hz, 1688 Hz, 2929 Hz, and 5000 Hz, divided evenly according to the Greenwood place map. The 6 models differed in how they processed the low-frequency information between 100 and 500 Hz. The first model used an eighth-order Butterworth filter to low-pass the original signal at 500 Hz to simulate the presence of residual acoustic hearing. This simulation is an ideal case of residual hearing with the subject having no impairment to filter width or dynamic range below 500 Hz. Most real subjects would have limitations in this region. This was used as the control and is representative of the best performance that could be achieved with a cochlear implant. This model will be referred to as the Hybrid model for the rest of the paper. The other five models had 2, 4, 8, 16 or 32 channels between 100 and 500 Hz, also spaced according to the Greenwood map. The corresponding total number of channels between 100 and 5000 Hz were therefore 6, 8, 12, 20, and 36. Given the narrow bandwidth of the lowest frequency channels in the 32-channel condition and the desire for as little overlap as possible between channels, 6000th order FIR filters were used for all channels. Each band was low-passed at 500 Hz with an 8th order Butterworth filter to allow for maximum preservation of any temporal envelope cues in the higher frequency bands. The sampling rate for all stimuli was 20 kHz.
Figure 6.

Filter bank models for Exp. 3. All models have 4 filters between 500 and 5000 Hz. One model includes low-pass information from an 8th order Butterworth filter. The other five models have 2, 4, 8, 16 and 32 6000th order FIR filters below 500 Hz.
The same test materials were used as in Exp. 2. Only SNRs of 5, 0, and −5 dB were used to avoid the asymptotic performance seen in unprocessed conditions at 10 dB SNR (Stickney submitted).
3. Procedure
The same testing procedure as in Exp. 2 was used.
B. Results and discussion
Figure 7 shows percent correct scores as a function of F0 difference for all 6 filter models (panels). The gray shaded region again represents the mean plus or minus one standard deviation for unprocessed speech at 0 dB SNR. The unprocessed speech result showed improved performance with increasing separation in F0 between the target and the masker. We would predict a similar trend by increasing the number of channels in the low-frequency region. A main effect was seen for the filter bank model [F(5,80)=12.8, p<0.05], F0 difference [F(2,32)=15.5, p<0.05], and SNR [F(2,32)=281.9, p<0.05]. Significant interactions were observed between model and SNR [F(10,160)=2.4, p<0.05], SNR and F0 difference [F(4,64)=2.9, p<0.05], and between model, SNR, and F0 difference [F(20,320)=1.9,p<0.05]. The effect of the filter bank model shows the general trend of increasing performance with increasing the number of channels. Due to interactions, a two-way ANOVA was conducted for each model on SNR and F0 difference. All six models showed a significant effect of SNR, but a significant effect of F0 difference was found only in the Hybrid model [F(2,32)=6.3, p<0.05], the 32-channel model [F(2,32)=5.4, p<0.05], and the 16-channel model [F(2,32)=5.2, p<0.05]. However, there was a significant interaction between SNR and F0 difference in the Hybrid model [F(4,64)=3.3, p<0.05], which was due to the asymptotic performance at 5 dB SNR. The 32- and 16-channel conditions produced no interaction between SNR and F0 difference. Instead, they demonstrated consistently improved performance as a function of the F0 difference over each SNR tested. A pair-wise ANOVA between the 32- and 16-channel conditions shows no significant difference between conditions [F(1,16)=2.0, p=0.18].
Figure 7.
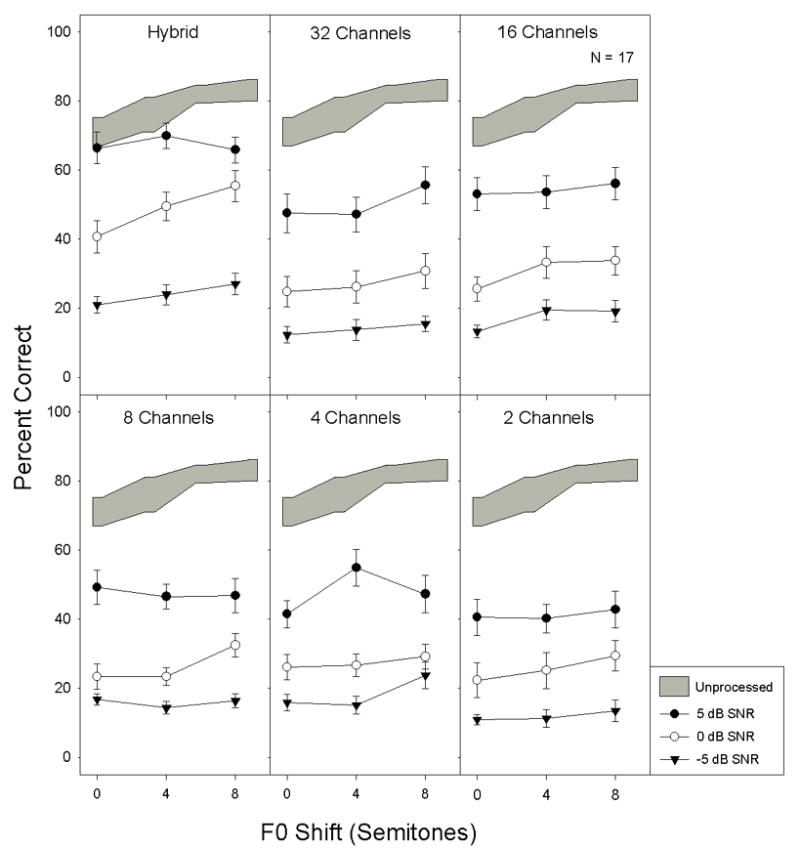
Data for Exp. 3. Percent correct scores for a speech with a competing talker task. Data are shown for six filter bank models, three signal to noise ratios, and three differences between F0 for the target and the masker. Error bars indicate the standard error of the mean.
Consistent with previous studies (Turner et al. 2004; Kong et al. 2005), the finding that the Hybrid model improved performance as a function of F0 difference provides additional evidence that the low-frequency acoustic component may allow for the separation of two voices, resulting in improved speech perception in a competing background talker. Although the 16- and 32-channel models showed improved performance with greater F0 separation, their overall level of performance was still lower than that with the unprocessed speech and the Hybrid model. This result is consistent with the idea that the number of channels at low-frequencies need to be increased and the fine-structure or phase information be preserved (Qin and Oxenham 2006; Zeng et al. 2005).
V. GENERAL DISCUSSION
A. Spectral versus Temporal cues
Exps. 1 and 2 evaluated the relative contributions of spectral and temporal envelope cues to pitch perception. Pitch information, conveyed by either a spectral mechanism as in the Low model or a temporal mechanism as in the High model, could improve F0 discrimination. However, when the overall number of spectral channels is limited, this improvement in F0 discrimination with spectral cues was compromised by a general degradation in speech intelligibility. Experiment 3 demonstrated that without a limit to the number of spectral channels, the tradeoff need not exist but this does not represent a real world situation due to the high degree of current overlap in real implants. The improvement in F0 discrimination with temporal cues showed less decrease in intelligibility but no benefit in noise. Until the number of independent channels is significantly increased, future cochlear implant speech processing strategies need to consider the tradeoff between F0 discrimination and speech intelligibility.
B. Performance Improves with Explicit Spectral Coding
Exp. 3 shows that at least 16 channels are needed below 500 Hz to support speech perception in noise based on the F0 cue. Figure 8 probes the acoustic basis of this improvement by showing spectrograms of a target sentence with the masker present at 0 dB SNR for each of the processing conditions. Frequency sweeps in the fundamental and first few harmonics are clear in the Hybrid condition. The 32-channel model preserves some of the frequency information, including F0 and its harmonics. The 16-channel model also retains some of this information, but to a lesser extent. The 8, 4 and 2 channel models do not preserve these frequency changes. The improved performance with 16 or more channels in a speech in noise task is a result of the explicit preservation of F0 by true spectral separation into adjacent channels.
Figure 8.

Spectrograms from Exp. 3. Target and masker sentences are presented at a 0 dB SNR. Notice the frequency sweeps in the Hybrid, 32 and 16 channel models and the absence of these sweeps in the 8, 4 and 2 channel models.
C. Implications for Cochlear Implants
To relate these simulation results to actual cochlear implants, we need to consider the validity of the experiments. In Experiment 1, the simulations all consisted of eight-channel vocoders, corresponding roughly to the maximum number of spectral channels available to current cochlear implant users, depending on the user and the task (Fishman et al. 1997; Friesen et al. 2001). Until the number of functional channels in current implants is increased, data from this experiment seem to be relevant. In Experiment 2, the temporal envelope cue in the High model was not sufficient to segregate speech streams. This result may not be valid in actual cochlear implant users because the cochlear implant users can detect modulations better than normally hearing individuals (Shannon 1993; Kohlrausch et al. 2000; Zeng 2004). The number of spectral channels in Experiment 3 greatly exceeded the number of usable spectral channels in actual cochlear implants. However, the result from Experiment 3 is highly relevant to current and future cochlear implant research. On the one hand, future cochlear implants may have more than 22 intracochlear electrodes (Clopton and Spelman 2003) or the existing device may be used to increase the number of functional channels by “virtual channels” (Donaldson et al. 2005; Wilson et al. 2005). On the other hand, the combined acoustic and electric hearing may provide the necessary number of spectral channels via the residual acoustic hearing (Turner et al. 2004; Kong et al. 2005). This may be limited, however, for users with minimal residual hearing who can have diminished or absent frequency selectivity (Faulkner et al. 1990).
VI. CONCLUSIONS
Consistent with previous studies, the present study showed that, at least in cochlear implant simulations, listeners are able to make use of both spectral and temporal envelope cues to improve F0 discrimination. However, the present study found that, with a limited number of frequency bands, an improvement in F0 discrimination from spectral cues degraded speech intelligibility, while the same improvement with temporal cues showed much less tradeoff. These results suggest two potential methods to address the F0 discrimination and speech intelligibility tradeoff. The first method would be to either enhance the temporal envelope cue or explicitly extract and deliver F0 to improve F0 discrimination. This method may, however, have limited benefits in noise. The second method would be to increase channel density to at least 16 spectral channels below 500 Hz to observe appreciable benefits of F0 separation in speech recognition in noise.
Acknowledgments
We would like to thank Hongbin Chen and Ginger Stickney for their assistance in experimental design and data interpretation. Dr. Andrew Faulkner and Abby Copeland provided helpful comments on an earlier version of this manuscript. The IEEE Sentences were provided by Dr. Louis Braida at the Sensory Communication Group of the Research Laboratory of Electronics at MIT. Dr. Hideki Kawahara at Wakayama University provided the STRAIGHT program that spectrally shifted the test material. This work was supported by a grant from the National Institutes of Health, NIDCD (2 R01 DC02267-07-12).
Footnotes
Portions of this work were presented at the 28th Midwinter Meeting of ARO, New Orleans, Louisiana, February 2005.
Publisher's Disclaimer: This is a PDF file of an unedited manuscript that has been accepted for publication. As a service to our customers we are providing this early version of the manuscript. The manuscript will undergo copyediting, typesetting, and review of the resulting proof before it is published in its final citable form. Please note that during the production process errors may be discovered which could affect the content, and all legal disclaimers that apply to the journal pertain.
Contributor Information
Jeff Carroll, Hearing and Speech Research Laboratory, Department of Biomedical Engineering, University of California, Irvine.
Fan-Gang Zeng, Hearing and Speech Research Laboratory, Departments of Anatomy and Neurobiology, Biomedical Engineering, Cognitive Sciences, and Otolaryngology–Head and Neck Surgery, University of California, Irvine.
References
- Anantharaman JN, Krishnamurthy AK, Feth LL. Intensity-weighted average of instantaneous frequency as a model for frequency discrimination. J Acoust Soc Am. 1993;94(2):723–729. doi: 10.1121/1.406889. [DOI] [PubMed] [Google Scholar]
- Brokx JPL, Nooteboom SG. Intonation and the perception separation of simultaneous voices. J Phonetics. 1982;10:23–36. [Google Scholar]
- Burns EM, Viemeister NF. Nonspectral Pitch. J Acoust Soc Am. 1976;60(4):863–869. [Google Scholar]
- Burns EM, Viemeister NF. Played-again SAM: Further observations on the pitch of amplitude-modulated noise. J Acoust Soc Am. 1981;70(6):1655–1660. [Google Scholar]
- Chang JE, Bai J, Zeng FG. Unintelligible low-frequency sounds improve simulated cochlear-implant speech recognition in noise. IEEE Transactions on Biomedical Engineering. 2006 doi: 10.1109/TBME.2006.883793. in press. [DOI] [PubMed] [Google Scholar]
- Clopton BM, Spelman FA. Technology and the future of cochlear implants. Ann Otol Rhinol Laryngol. 2003;119(9 part 2 suppl):26–32. doi: 10.1177/00034894031120s906. [DOI] [PubMed] [Google Scholar]
- Donaldson GS, Kreft HA, Litvak L. Place-pitch discrimination of single- versus dual-electrode stimuli by cochlear implant users (L) J Acoust Soc Am. 2005;118(2):623–626. doi: 10.1121/1.1937362. [DOI] [PubMed] [Google Scholar]
- Dorman MF, Loizou PC, Rainey D. Speech intelligibility as a function of the number of channels of stimulation for signal processing using sine-wave and noise-band outputs. J Acoust Soc Am. 1997;102(4):2403–2411. doi: 10.1121/1.419603. [DOI] [PubMed] [Google Scholar]
- Dorman MF, Spahr AJ, Loizou PC, Dana CJ, Schmidt JS. Acoustic Simulations of Combined Electric and Acoustic Hearing (EAS) Ear Hear. 2005;26(4):371–380. doi: 10.1097/00003446-200508000-00001. [DOI] [PubMed] [Google Scholar]
- Faulkner A, Rosen S, Moore BC. Residual frequency selectivity in the profoundly hearing-impaired listener. Br J Audiol. 1990;24(6):381–392. doi: 10.3109/03005369009076579. [DOI] [PubMed] [Google Scholar]
- Fishman KE, Shannon RV, Slattery WH. Speech recognition as a function of the number of electrodes used in the SPEAK cochlear implant speech processor. J Speech Lang Hear Res. 1997;40:1201–1215. doi: 10.1044/jslhr.4005.1201. [DOI] [PubMed] [Google Scholar]
- Friesen LM, Shannon RV, Baskent D, Wang X. Speech recognition in noise as a function of the number of spectral channels: Comparison of acoustic hearing and cochlear implants. J Acoust Soc Am. 2001;110(2):1150–1163. doi: 10.1121/1.1381538. [DOI] [PubMed] [Google Scholar]
- Fu Q-J, Zeng F-G, Shannon RV, Soli SD. Importance of tonal envelope cues in Chinese speech recognition. J Acoust Soc Am. 1998;104(1):505–510. doi: 10.1121/1.423251. [DOI] [PubMed] [Google Scholar]
- Geurts L, Wouters J. Coding of the fundamental frequency in continuous interleaved sampling processors for cochlear implants. J Acoust Soc Am. 2001;109(2):713–726. doi: 10.1121/1.1340650. [DOI] [PubMed] [Google Scholar]
- Geurts L, Wouters J. Better place-coding of the fundamental frequency in cochlear implants. J Acoust Soc Am. 2004;115(2):844–852. doi: 10.1121/1.1642623. [DOI] [PubMed] [Google Scholar]
- Green T, Faulkner A, Rosen S, Macherey O. Enhancement of temporal periodicity cues in cochlear implants: Effects on prosodic perception and vowel identification. J Acoust Soc Am. 2005;118(1):375–385. doi: 10.1121/1.1925827. [DOI] [PubMed] [Google Scholar]
- Greenwood DD. A cochlear frequency-position function for several species-29 years later. J Acoust Soc Am. 1990;87(6):2592–2605. doi: 10.1121/1.399052. [DOI] [PubMed] [Google Scholar]
- Hillenbrand J, Getty LA, Clark MJ, Wheeler K. Acoustic characteristics of American English vowels. J Acoust Soc Am. 1995;97(5 Part 1):3099–3111. doi: 10.1121/1.411872. [DOI] [PubMed] [Google Scholar]
- Kawahara H, Masuda-Katsuse I, Cheveigne Ad. Restructuring speech representations using a pitch-adaptive time-frequency smoothing and an instantaneous-frequency-based F0 extraction: Possible role of a repetitive structure in sounds. Speech Communication. 1999;27:187–207. [Google Scholar]
- Kohlrausch A, Fassel R, Dau T. The influence of carrier level and frequency on modulation and beat-detection thresholds for sinusoidal carriers. J Acoust Soc Am. 2000;108:723–734. doi: 10.1121/1.429605. [DOI] [PubMed] [Google Scholar]
- Kong Y-Y, Stickney GS, Zeng F-G. Speech and melody recognition in binaurally combined acoustic and electric hearing. J Acoust Soc Am. 2005;117(3 Part 1):1351–1361. doi: 10.1121/1.1857526. [DOI] [PubMed] [Google Scholar]
- Lan N, Nie KSKG, Zeng F-G. A novel speech-processing strategy incorporating tonal information for cochlear implants. IEEE Trans Biomed Eng. 2004;51(5):752–60. doi: 10.1109/TBME.2004.826597. [DOI] [PubMed] [Google Scholar]
- Laneau J, Wouters J, Moonen M. Improved Music Perception with Explicit Pitch Coding in Cochlear Implants. Audiol Neurotol. 2006;11(1):38–51. doi: 10.1159/000088853. [DOI] [PubMed] [Google Scholar]
- Leigh JR, Henshall KR, McKay CM. Optimizing frequency-to-electrode allocation in cochlear implants. J Am Acad Audiol. 2004;15(8):574–584. doi: 10.3766/jaaa.15.8.5. [DOI] [PubMed] [Google Scholar]
- Levitt H. Transformed up-down methods in psychoacoustics. J Acoust Soc Am. 1971;49(2 Suppl 2):467+. [PubMed] [Google Scholar]
- Luo X, Fu Q-J. Enhancing Chinese tone recognition by manipulating amplitude envelope: Implications for cochlear implants. J Acoust Soc Am. 2004;116(6):3659–3667. doi: 10.1121/1.1783352. [DOI] [PubMed] [Google Scholar]
- McKay CM, McDermott HJ, Clark GM. Pitch percepts associated with amplitude-modulated current pulse trains in cochlear implantees. J Acoust Soc Am. 1994;96(5 Part 1):2664–2673. doi: 10.1121/1.411377. [DOI] [PubMed] [Google Scholar]
- Nelson DA, Van Tasell DJ, Schroder AC, Soli S, Levine S. Electrode ranking of “place pitch” and speech recognition in electric hearing. J Acoust Soc Am. 1995;98(4):1987–1999. doi: 10.1121/1.413317. [DOI] [PubMed] [Google Scholar]
- Nie K, Stickney G, Zeng F-G. Encoding frequency modulation to improve cochlear implant performance in noise. IEEE Trans Biomed Eng. 2005;52(1):64–73. doi: 10.1109/TBME.2004.839799. [DOI] [PubMed] [Google Scholar]
- Nie K, Barco A, Zeng F-G. Spectral and temporal cues in cochlear implant speech perception. Ear Hear. 2006;27(2):208–217. doi: 10.1097/01.aud.0000202312.31837.25. [DOI] [PubMed] [Google Scholar]
- Qin MK, Oxenham AJ. Effects of simulated cochlear-implant processing on speech reception in fluctuating maskers. J Acoust Soc Am. 2003;114(1):446–454. doi: 10.1121/1.1579009. [DOI] [PubMed] [Google Scholar]
- Qin MK, Oxenham AJ. Effects of envelope-vocoder processing on F0 discrimination and concurrent-vowel identification. Ear Hear. 2005;26(5):451–460. doi: 10.1097/01.aud.0000179689.79868.06. [DOI] [PubMed] [Google Scholar]
- Qin MK, Oxenham AJ. Effects of introducing unprocessed low-frequency information on the reception of envelope-vocoder processed speech. J Acoust Soc Am. 2006;119(4):2417–26. doi: 10.1121/1.2178719. [DOI] [PubMed] [Google Scholar]
- Rothauser EH, Chapman WD, Guttman N, Hecker MHL, Norby KS, Silbiger HR, Urbanek GE, Weinstock M. IEEE recommended practice for speech quality measurements. IEEE Transactions on Audio and Electroacoustics. 1969;AU-17(3):225–246. [Google Scholar]
- Shannon RV. Psychophysics of electric stimulation. In: Tyler RS, editor. Cochlear Implants: Audiological Foundations. Singular Publishing Group Inc; San Diego, CA: 1993. pp. 357–388. [Google Scholar]
- Shannon RV, Zeng F-G, Kamath V, Wygonski J, Ekelid M. Speech recognition with primarily temporal cues. Science. 1995;270(5234):303–304. doi: 10.1126/science.270.5234.303. [DOI] [PubMed] [Google Scholar]
- Shannon RV, Jensvold A, Padilla M, Robert ME, Wang X. Consonant recordings for speech testing. J Acoust Soc Am. 1999;106(6):L71–L74. doi: 10.1121/1.428150. [DOI] [PubMed] [Google Scholar]
- Stickney GS, Assmann P, Chang J, Zeng F-G. Effects of cochlear implant processing and fundamental frequency on the intelligibility of competing sentences. doi: 10.1121/1.2750159. (In submission) [DOI] [PubMed] [Google Scholar]
- Stickney GS, Zeng F-G, Litovsky R, Assmann P. Cochlear implant speech recognition with speech maskers. J Acoust Soc Am. 2004;116(2):1081–1091. doi: 10.1121/1.1772399. [DOI] [PubMed] [Google Scholar]
- Turner CW, Gantz BJ, Vidal C, Behrens A, Henry BA. Speech recognition in noise for cochlear implant listeners: Benefits of residual acoustic hearing. J Acoust Soc Am. 2004;115(4):1729–1735. doi: 10.1121/1.1687425. [DOI] [PubMed] [Google Scholar]
- von Ilberg C, Kiefer J, Tillein J, Pfenningdorff T, Hartmann R, Sturzebecher E, Klinke R. Electro-acoustic stimulation of the auditory system. ORL J Otorhinolaryngol Relat Spec. 1999;61:334–340. doi: 10.1159/000027695. [DOI] [PubMed] [Google Scholar]
- Wegel RL, Lane CE. The auditory masking of one pure tone by another and its probable relation to the dynamics of the inner ear. Phys Rev. 1924;23:266–285. [Google Scholar]
- Whalen DH, Magen HS, Pouplier M, Kang AM, Iskarous K. Vowel production and perception: Hyperarticulation without a hyperspace effect. Lang Speech. 2004;47(2):155–174. doi: 10.1177/00238309040470020301. [DOI] [PubMed] [Google Scholar]
- Wilson BS, Schatzer R, Lopez-Poveda EA, Sun X, Lawson DT, Wolford RD. Two New Directions in Speech Processor Design for Cochlear Implants. Ear Hear. 2005;26(4 Suppl):73S–81S. doi: 10.1097/00003446-200508001-00009. [DOI] [PubMed] [Google Scholar]
- Xu L, Tsai Y, Pfingst BE. Features of stimulation affecting tonal-speech perception: Implications for cochlear prostheses. J Acoust Soc Am. 2002;112(1):247–258. doi: 10.1121/1.1487843. [DOI] [PMC free article] [PubMed] [Google Scholar]
- Zeng F-G. Compression and Cochlear Implants. In: Bacon SP, Fay RR, Popper AN, editors. Compression: From Cochlea to Cochlear Implants. Springer-Verlag; New York: 2004. pp. 184–220. [Google Scholar]
- Zeng F-G, Nie K, Stickney G, Kong Y-Y, Vongphoe M, Bhargave A, Wei C, Cao K. Speech recognition with amplitude and frequency modulations. Proc Natl Acad Sci U S A. 2005;102(7):2293–2298. doi: 10.1073/pnas.0406460102. [DOI] [PMC free article] [PubMed] [Google Scholar]