
Figure 2.
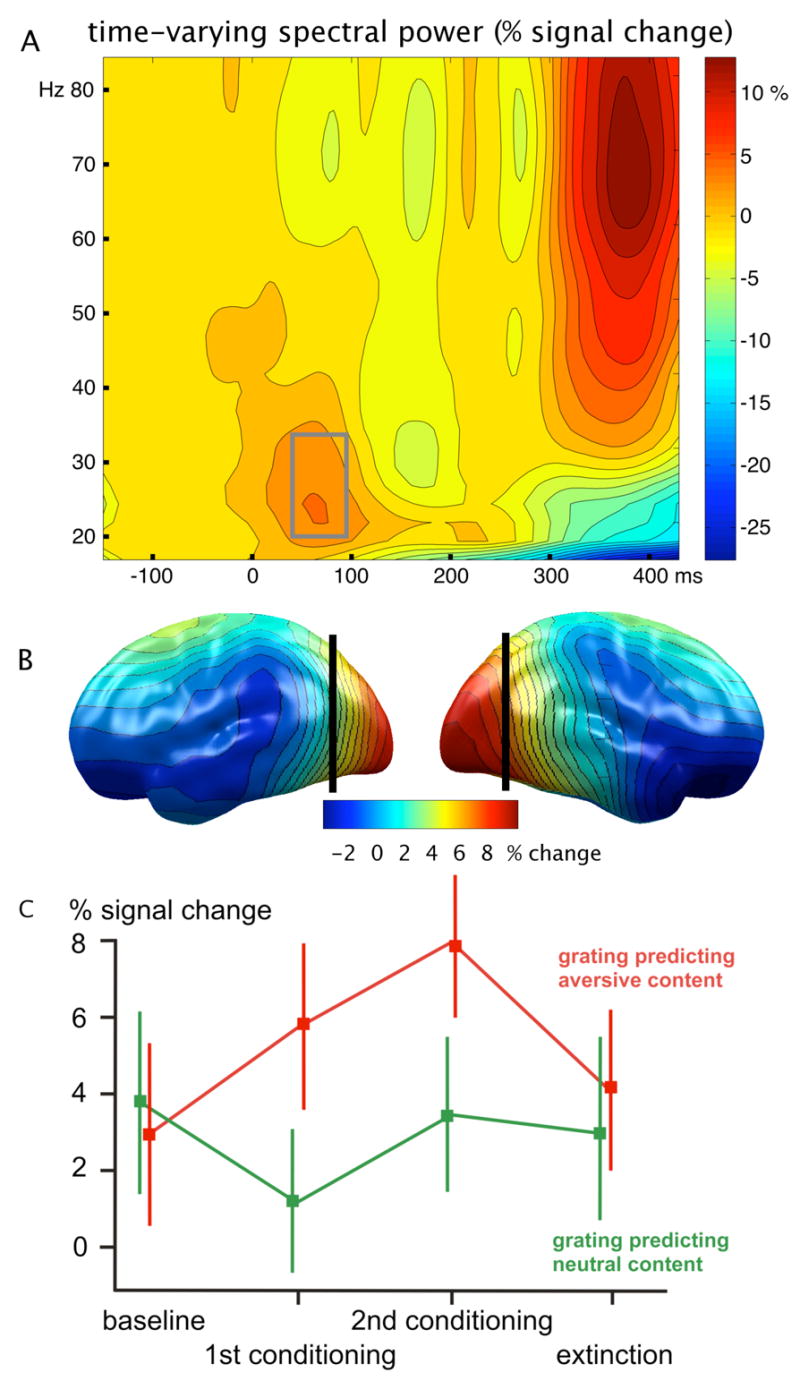
A: Baseline-corrected time-frequency representation of the visual oscillatory response recorded at posterior EEG sensors, across the four experimental blocks (baseline, 1st conditioning block, 2nd conditioning block, extinction). Power enhancement at frequencies between 18 and 35 Hz is visible at around 60–90 ms post-stimulus, reflecting early visual processing. B: Distribution of the early evoked oscillatory response, projected to a standard brain surface. Sites posterior to the vertical black lines entered the statistical analysis of time-varying spectral power and phase synchrony as a function of block and experimental condition. C: Power changes as a function of condition and block for this early response. An increase in oscillatory activity across time is shown for the response to gratings predicting aversive pictures, indicating that primary visual response is increasingly modulated as a function of aversive arousal. Bars indicate the standard error of the mean.