
Figure 3.
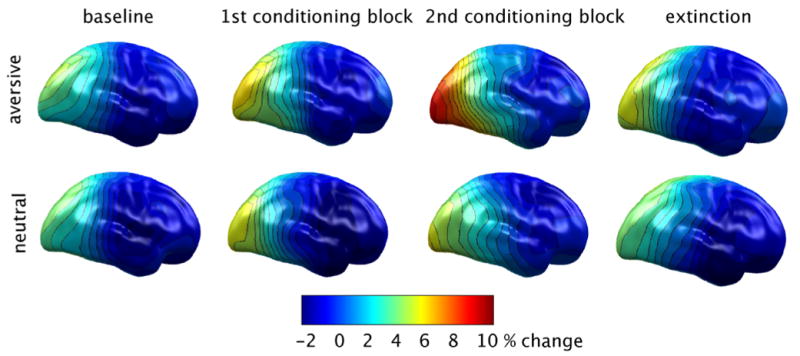
Phase synchrony maps showing the relative changes of synchrony between reference sites in visual cortex and the other regions examined here with respect to a pre-stimulus baseline. Areas of high synchrony with visual cortex are shown in red. Data reflect an average across 16 participants.