
Figure 4.
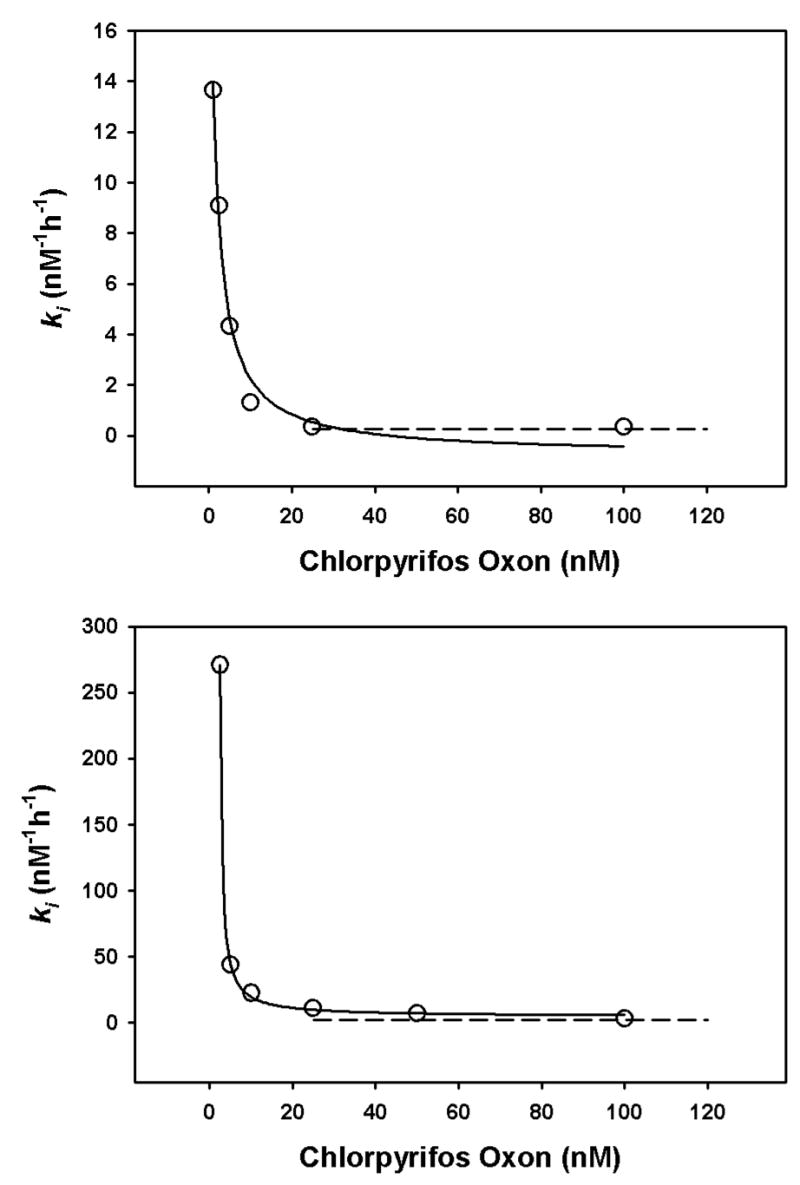
Relationship of ki and chlorpyrifos oxon concentration at 24° (upper panel, and 37° (lower panel). Each open circles depicts a ki determined from inhibition profiles containing at least 10 data points (such as in Figures 4), and the solid line is the best-fit line from the equation y=a/(x+b)+c. At 24°, a=33.97, b=1.13, and c=0.74, whereas at 37° a=118.81, b=2.05, and c=4.48. The dashed lines depict the kis determined by the traditional method of Main (1964), utilizing oxon concentrations greater than 20 nM.