
Figure 7.
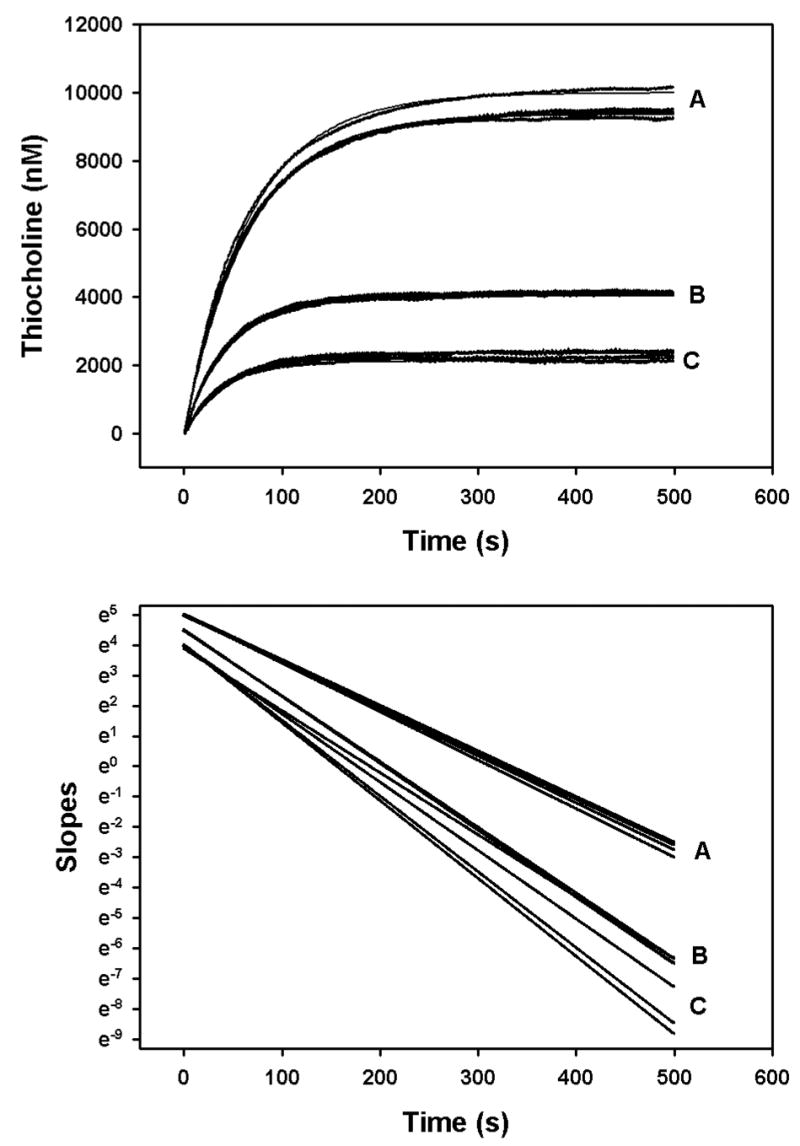
Primary plot (upper panel) and secondary plot (lower panel) for determination of Kd and k2 for 100 nM chlorpyrifos oxon by the zero-time method at 24°. The filled circles in the upper panel show the data generated by the stopped flow spectrophotometer, and the solid lines are the best-fit line as described under “Methods”. The acetylcholinesterase active site concentrations ranged from 13 – 15 pM within the mixing chamber. The concentrations of acetylthiocholine used were: 0.055 mM (designated as A); 0.0275 mM (designated as B); and 0.01375 mM (designated as C). The lines in the lower panel are the slopes of the fitted lines from the upper panel, determined by analysis with cubic splines (Barak et al, 1995). The slopes and intercepts of the lines in the lower panel were determined by linear regression analyses, and were used in Equations 8 and 10 to calculate Kd and k2.