
Figure 8.
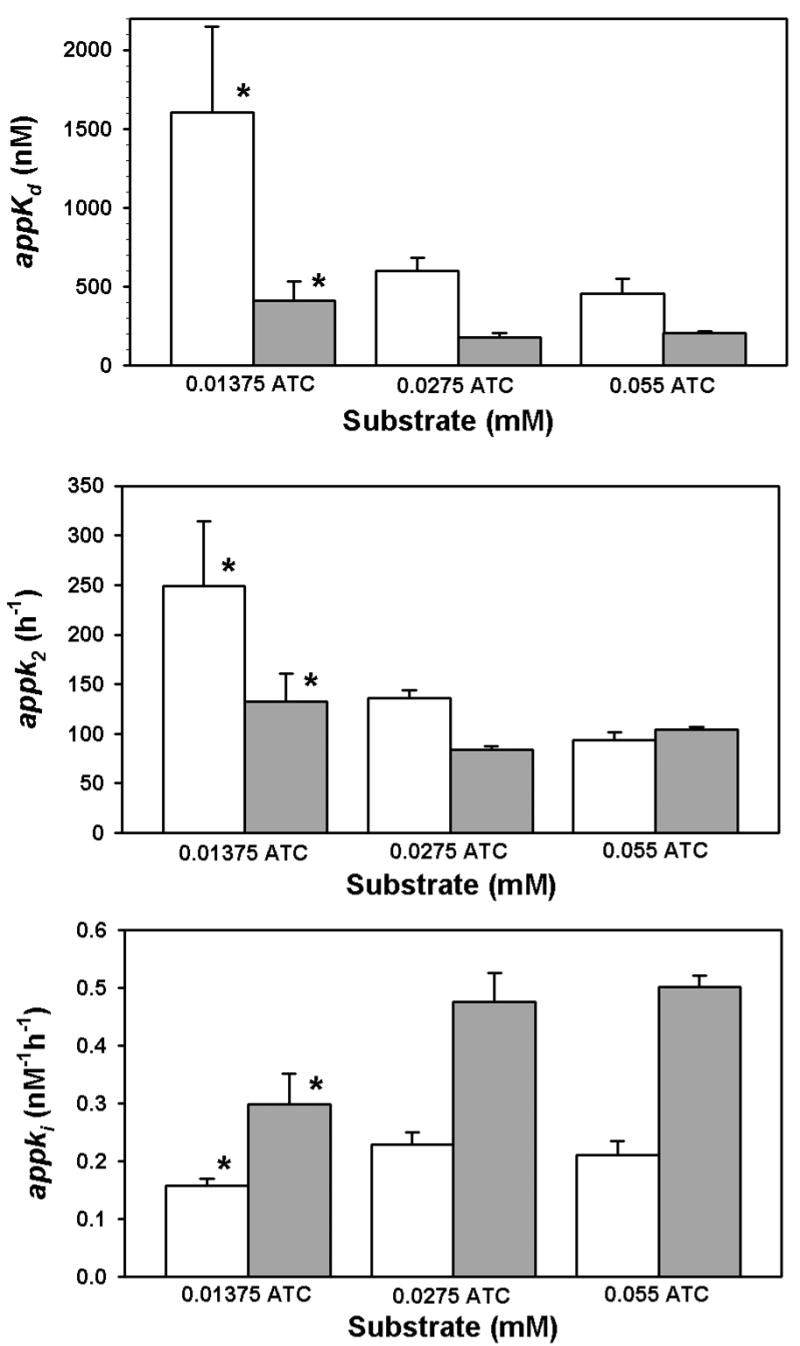
Relationship between acetylthiocholine concentration and appk2, appKd, and appki for 100 nM chlorpyrifos oxon at 24° (open bars) and 37° (filled bars). Each bar represents the mean ± standard deviation of at least three determinations as described in Figure 7. In the upper and middle panels, the asterisk indicates a significant difference (p<0.05) from the other groups at the same temperature by a Kruskal-Wallis one way analysis of variance on ranks, followed by multiple comparisons with Dunn’s Method. In the lower panel the asterisk indicates a significant difference (p<0.05) from the other two groups at the same temperature by a one way analysis of variance followed by multiple comparisons with the Student-Newman-Keuls method.