
Figure 9.
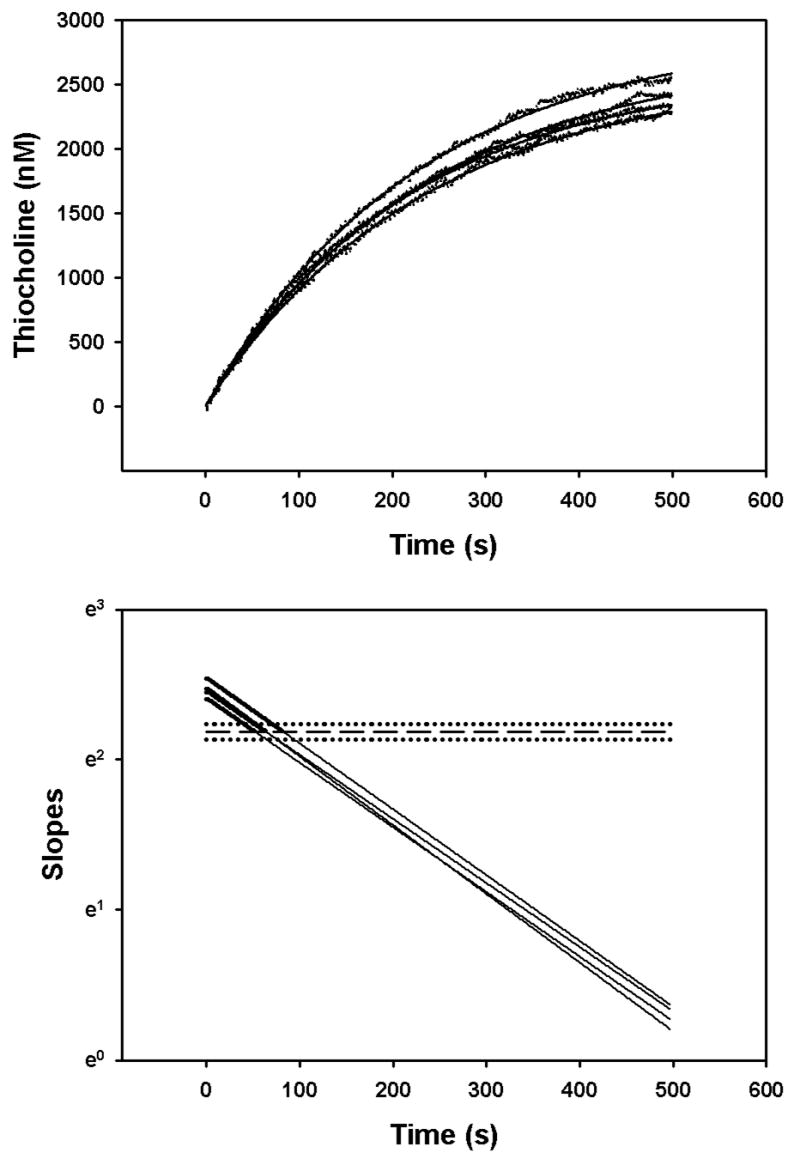
Determination of initial velocities of 0.0275 mM acetylthiocholine hydrolysis in the presence of 10 nM chlorpyrifos oxon. The upper panel shows the empirical data (filled circles) fitted by equation (9) (solid lines). The acetylcholinesterase active site concentrations were 0.9 – 1 pM in the mixing chamber of the stopped flow spectrophotometer. The solid lines in the lower panel show the slopes of the fitted curves from the upper panel. The slopes were determined as described in “Methods”. The bold portions of the curves indicate velocities greater than control velocities (without chorlpyrifos oxon). The control velocity mean (designated by the dashed line in the lower panel) and standard deviation (designated as the dotted lines) for an n=4 was 8.9059 ± 0.4813 nM/s.