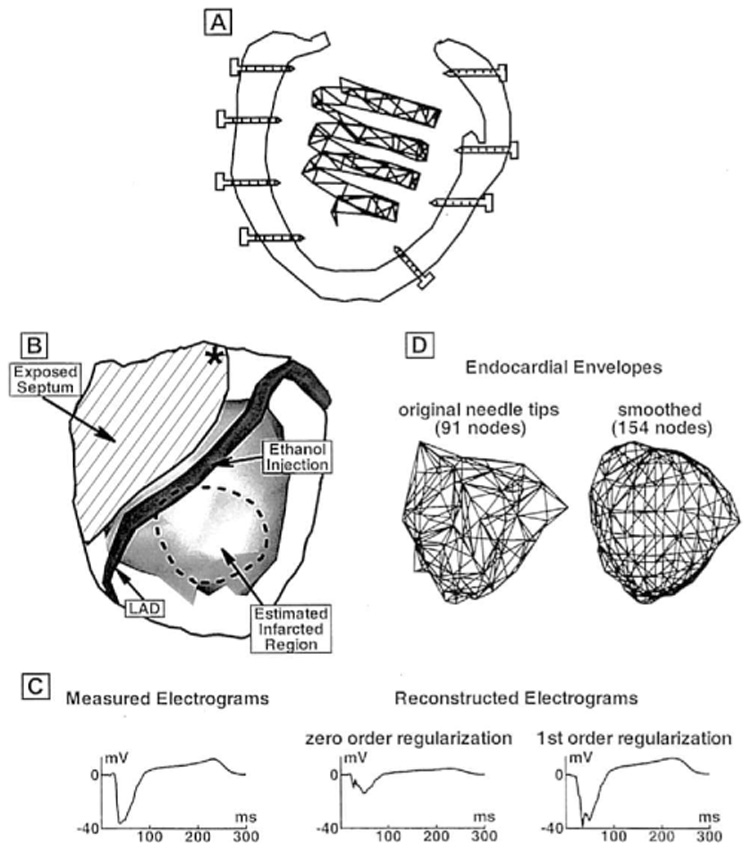
Figure 1.

(A) Schematic diagram of the noncontact spiral catheter inside the isolated left ventricle (LV). Several of the intramural needles whose tip electrodes are used to directly measure endocardial potentials also are shown. (B) Schematic illustration of experimental preparation. LV epicardium is transparent and delineated by a solid border. The LV endocardium, as seen from the epicardium, is shown as a shaded (gray) surface. Left anterior descending coronary artery (LAD) is shown on the epicardium. The estimated infarcted region is delineated by the dashed border. To the left of the LAD, the right ventricle was surgically removed and the exposed septum is indicated. Asterisk marks the site of programmed stimulation. (C) Example of electrogram reconstruction that is greatly improved using first-order regularization (right column) compared with zero-order regularization (middle column). Measured electrogram is shown on the left for comparison. (D) Schematic diagram of the two endocardial envelopes on which endocardial potentials are reconstructed. Left panel shows the endocardial envelope constructed by connecting the endocardial tips of the electrode needles. Right panel shows the smoothed endocardial envelope with evenly distributed nodes and uniform elements.
