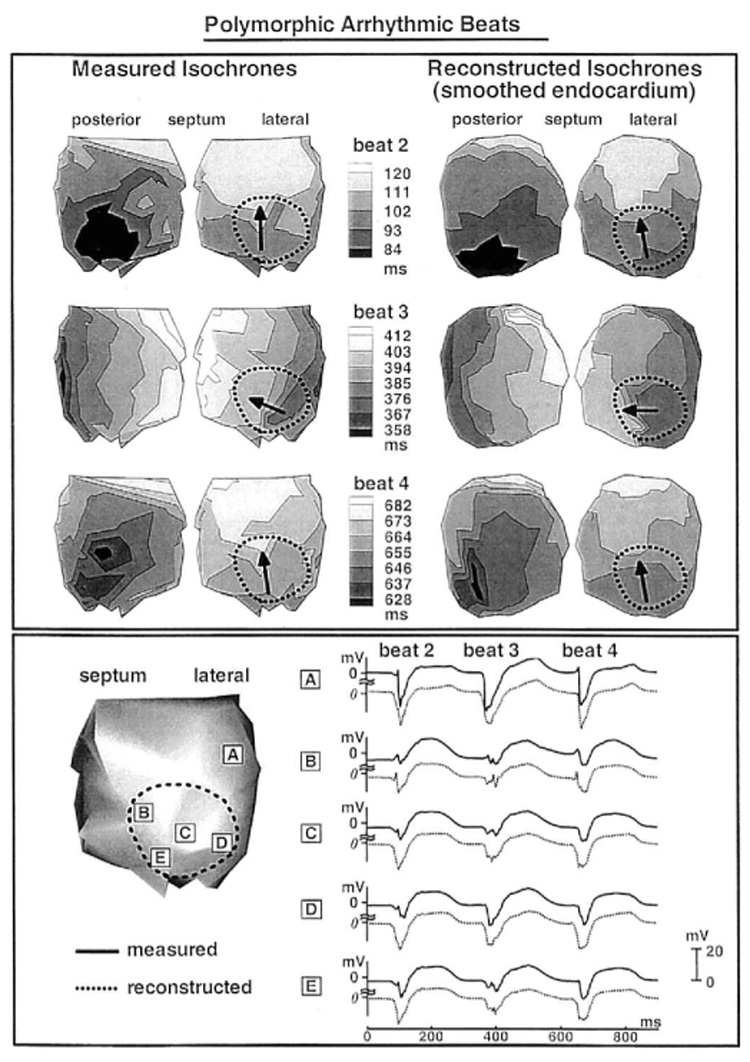
Figure 7.

Top panel: Endocardial activation sequences (isochrones) of three consecutive arrhythmic beats during a polymorphic arrhythmia. Left: Measured. Right: Reconstructed. Black arrows inside the infarct show direction of propagation. Measured (solid) and reconstructed (dashed) endocardial electrograms corresponding to the three beats are shown in A to E of the bottom panel. The sites of these electrograms are shown on the left.
