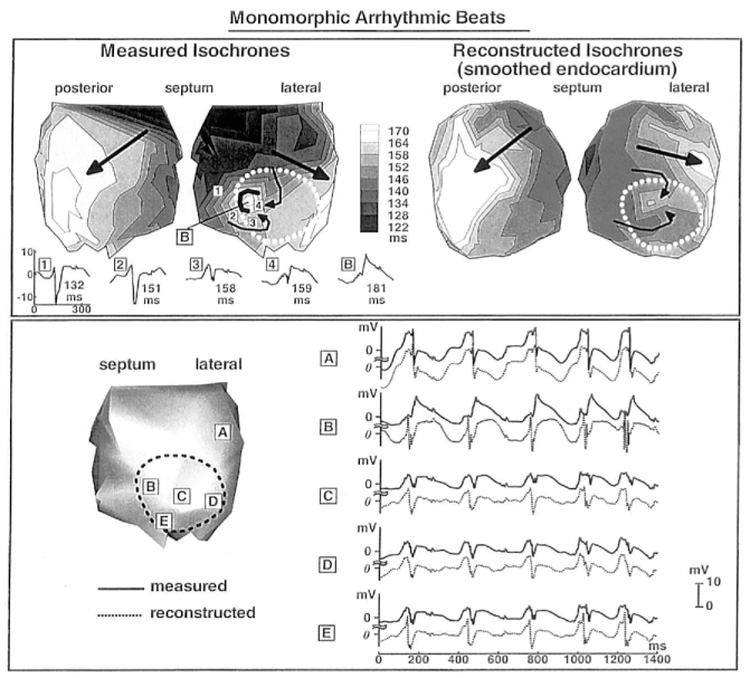
Figure 8.

Top panel: Isochrones for one cycle of a monomorphic arrhythmia. Left: Measured. Right: Reconstructed. Conduction block near site B is delineated as a black horseshoe in the measured map. Small curved arrows indicate local activation sequence near the block region. Large arrows indicate the direction of propagation of the global wavefront. Numbers 1 to 4 and letter B on the measured isochronal map indicate the locations of electrograms displayed below the map. Local activation time is shown next to each electrogram. A to E in bottom panel show selected measured (solid lines) and reconstructed (dashed lines) electrograms from corresponding endocardial sites (left).
