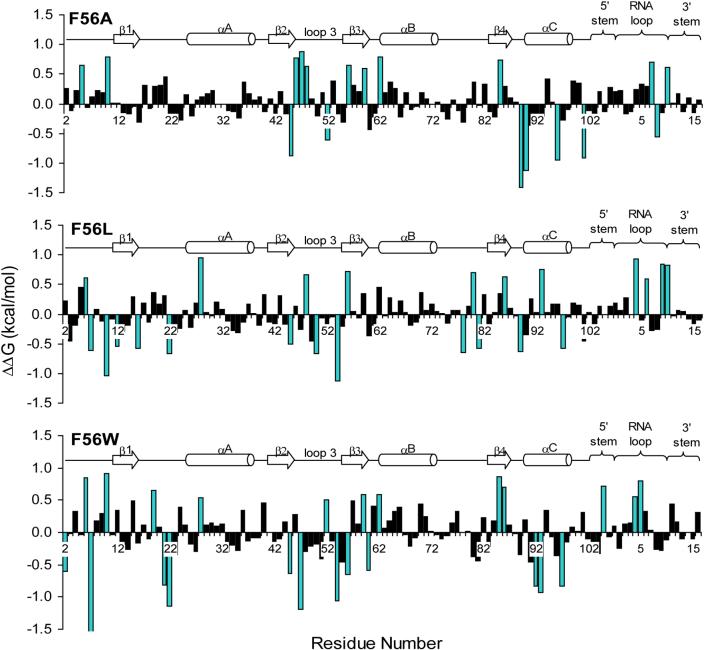
Figure 6.
Per residue free energy decomposition of F56 mutants compared to wild type (ΔΔG, kcal/mol) scaled according to Equation 10. The secondary structure of U1A residues (2−102) and SL2 RNA (−5 to 16) is indicated. Residues with ΔΔG values ±0.5 kcal/mol compared to wild type are highlighted in blue. The truncated value for Arg7 in the F56W mutant is −1.55 kcal/mol.

