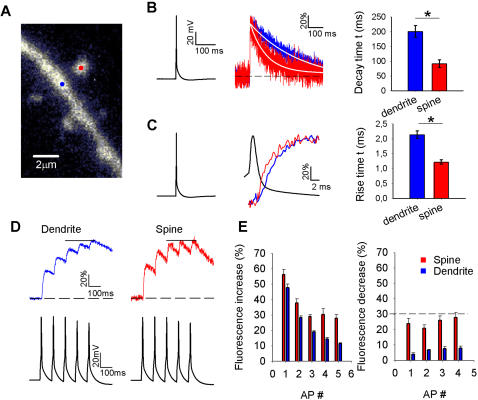
Figure 1. Fast two-photon imaging of calcium rise times in spines and dendrites.
A. Image of a targeted spine and dendrite. The laser was successively parked on the spine and dendrite at the sites indicated by the red and blue dot, respectively. B. Fluorescence decay time measurements following a single AP evoked in the soma (left panel) in a dendrite (blue) and spine (red; middle panel). Fluorescence traces were normalized to the peak to facilitate comparison of kinetics between spines and dendrites. White lines represent a mono-exponential fit to the fluorescence decay. Summary data for all fluorescence decay time measurements evoked by a single AP (n = 22 for both spines and dendrites, right panel). Time constants were obtained from mono-exponential fits to fluorescence during the decay phase * p<0.01. C. Same fluorescence changes and AP as in B (left panel), but on a smaller time scale to illustrate differences in rise times of dendrites and spines (middle panel). Traces were again normalized to facilitate comparison. Summary data of all fluorescence rise time measurements evoked by a single AP (n = 22 for both spines and dendrites, right panel) with time constants obtained from mono-exponential fits to fluorescence during the rising phase. *P<0.01. D. Fluorescence changes measured with two-photon point imaging from dendrites (blue) and spines (red) during AP trains. Lower panel: voltage traces with the AP trains induced in the soma. E. Summary data of fluorescence changes during AP trains. Left panel: step sizes induced by individual APs during the 50 Hz train (n = 9). Note that the step sizes continue to decrease in dendrites whereas they remain larger in spines. Right panel: fluorescence decreases after each AP in 50 Hz train. Dotted line indicates the average fluorescence increase induced by the last 3 APs in the train. The decreases in spines almost match these step increases.

