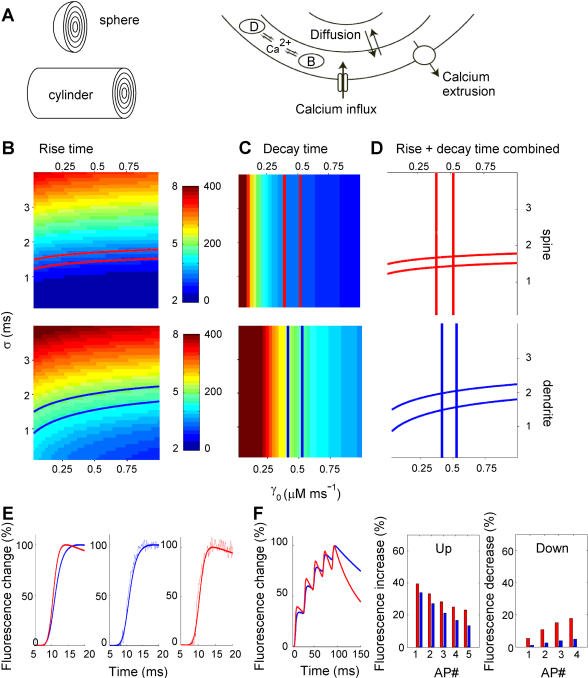
Figure 3. Dynamic modeling of rapid calcium signaling in spines and dendrites.
A. Schematic representation of the model components. Spines were modeled as a sphere, dendrites were modeled as a cylinder. Calcium entered and was removed from the outer shell only (shell number 0). Endogenous calcium buffer (B) was fixed while calcium, and calcium indicator dye (D) diffused freely among shells. B, C. Parameter space analysis for the model parameters σ (standard deviation of the Gaussian calcium influx) and γ0 (intrinsic extrusion rate). B. Color-coded plot of fluorescence 10% to 90% rise times as a function of σ and γ0 for spines (upper panel) and dendrites (lower panel). Simulations were performed for different combinations of σ and γ0 with all the other parameters set at their default value (Table 2). Total fluorescence was calculated from the relative contributions of all shells corrected for shell volume. 10–90% rise times were obtained from the total fluorescence signal and plotted in the parameter space for each simulation. Contours indicate the location of fluorescence rise time values obtained in point scan experiments for spines (red) and dendrites (blue) in the parameter space (spine: 3.0–3.4 ms; dendrite: 4.4–5.0 ms). C. Similar plots as in B for fluorescence decay times for spines (upper panel) and dendrites (lower panel). Decay times were fitted from the total fluorescence signal with a mono-exponential. Contours indicate experimental range of decay time constants for spines (red) and dendrites (blue) (spine: 80–100 ms; dendrite: 180–220 ms). Scale bars for color-coding show rise times (left scale) and decay times (right scale) in ms. C. Overlay of contour plots of rise times and decay times showing areas of overlap where the model fits both experimental rise and decay times in spines and dendrites correctly. From these areas the center co-ordinates were extracted for σ and γ0 for spines and dendrites that were used as default values in the other simulations in the paper (Table 2). E. Traces of AP-induced fluorescence changes in spines (red) and dendrites (blue) generated by the model plotted on top of representative experimental traces of AP-induced fluorescence changes in spines (middle panel) and dendrites (right panel). F. Traces of calcium bound dye in spines (red) and dendrites (blue) in response to a 50 Hz AP train of 5 APs cf Figure 2E. Quantification of fluorescence step sizes (middle panel) and fluorescence decreases after APs (right panel) during the AP train calculated by the model cf Figure 2F.

