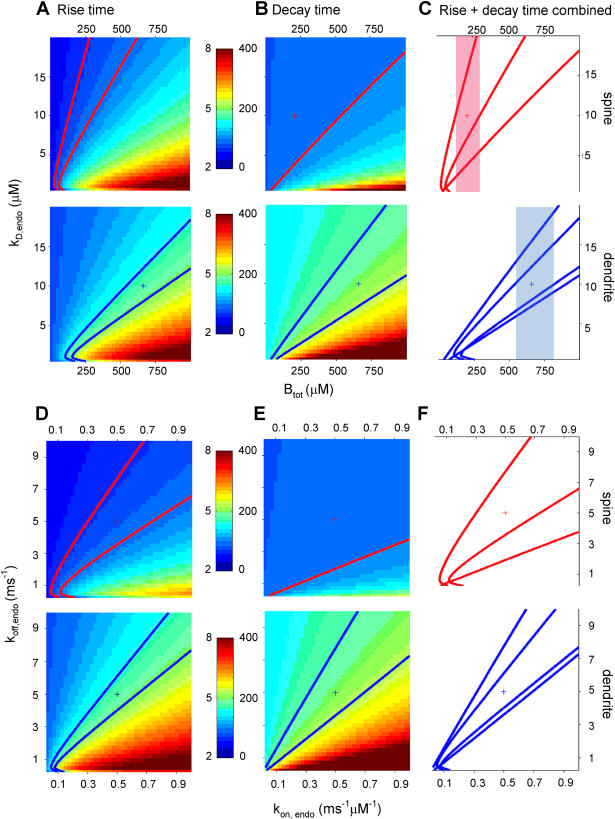
Figure 5. Effect of buffer parameters on calcium dynamics.
A–C. Parameter space analysis similar as in Figure 3 and 4 for model parameters KD,endo (dissociation constant for endogenous buffer) and Btot,endo (total concentration endogenous buffer). Plus signs indicate default parameter values for spines (red) and dendrites (blue) as listed in Table 2. C. Overlay of contour plots of rise times and decay times show areas of overlap where the model fits the experimental rise and decay times, with different ranges of Btot,endo for spines (transparent red bar) and dendrites (transparent blue bar). D–F Similar analysis for model parameters kon,endo (binding rate of the endogenous buffer) and koff, endo (unbinding rate of the endogenous buffer). F. Parameter ranges for kon,endo and koff, endo in spines and dendrites display a large overlap.

