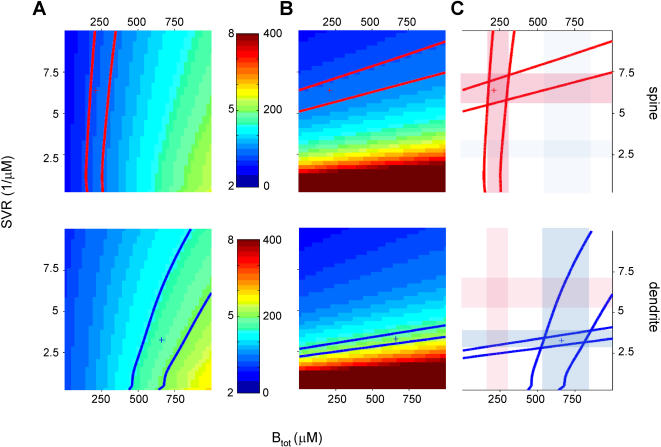
Figure 6. Effect of surface-to-volume ratio and buffer concentration on calcium dynamics.
A–C. Parameter space analysis as in Figures 3– 5 for model parameters SVR (surface-to-volume ratio) and Btot,endo (total endogenous buffer concentration). C. Parameter ranges for both SVR and Btot,endo differ between spines (red transparent bars) and dendrites (blue transparent bars).

