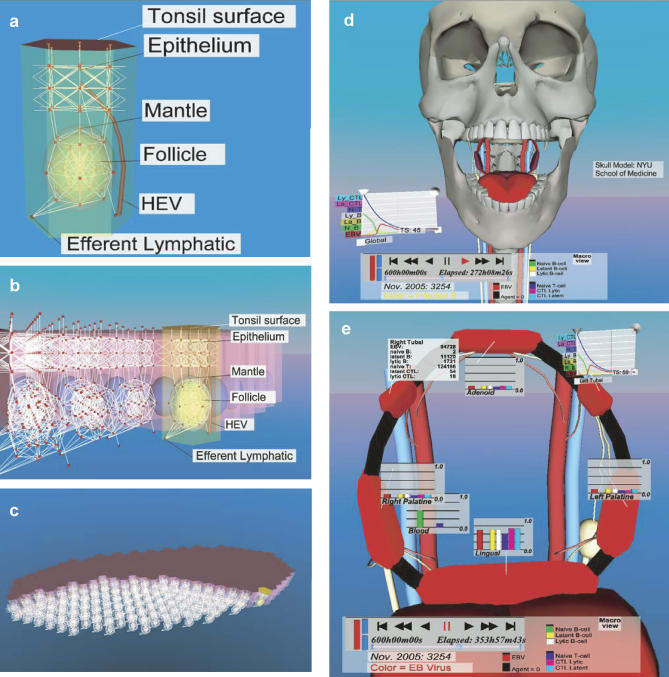
Figure 2. Representative Fields from the Simulation's Virtual Environment (IRVE).
For more details on (A–C), see Video S1, and for more on (D and E) see Video S2.
(A) The basic unit, used to construct the tonsil grid, consists of a solid hexagonal structure representing surface epithelium, lymphoid tissue, and a single germinal center/follicle. The virtual grid along which the agents move is shown as white lines, and the nodes where agents reside and interact are depicted as red boxes. Each hexagonal unit has one HEV entry point from the peripheral blood and one exit point into the lymphatic system.
(B) A view from the side of a single tonsil showing how the hexagonal base units are packed to create the entire grid of the tonsil lymphoepithelium.
(C) An overview of a single complete tubal tonsil showing part of its surface and part of its internal structure.
(D) Skull level view of the simulation showing the on screen control panel (bottom of figure) and an example of one form of graphic representation of the global status of the infection (line graphs, left).
(E) A view at the level of the entire Waldeyer ring demonstrating different methods of quantitation. Graphics in the form of numbers (top left) or bar graphs for a given time step and time line graphs (top right) are shown for various compartments of the simulation. The color signature for the ring is red, which denotes free Vir. The color of the ring denotes the type and level of agent being shown. In this case, the intense red color indicates a high level of free Vir throughout the ring (for an example of infection spreading throughout a single lymph node or the entire ring visualized by changing color intensity, see Figure 3 and Video S2). Note also the draining lymphatics (white vessels) and peripheral circulation (red and blue vessels). These images are screen shots taken on 7/30/2006.

