
Figure 3. Contrast responsivity in MT+ correlates with Phonological Awareness scores.
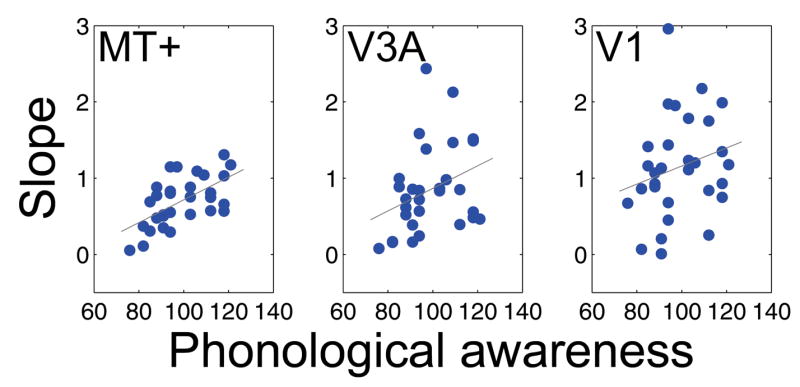
Each point is a measurement from a single subject. The X-axis measures Phonological Awareness (CTOPP) standardized scores. The Y-axis measures the slope of a linear function through the mean BOLD contrast values plotted against log stimulus contrast. Slopes are averaged across hemispheres for each subject (N=30) for each ROI. The three panels are measurements in three different cortical regions: MT+ (left panel), V3A (center) and V1 (right panel). The correlation between responsivity and phonological awareness in MT+ is r = 0.597 (r2 = 0.36, p<0.0005). The correlations within left and right MT+ are significant as well (see supplemental Figure S2). The correlation in V1 is not significant (r = 0.23; p = 0.2) and in V3A it is marginal (r = 0.33; p = 0.08). Shown in gray are the regression lines fit to data points to minimize the mean square error.