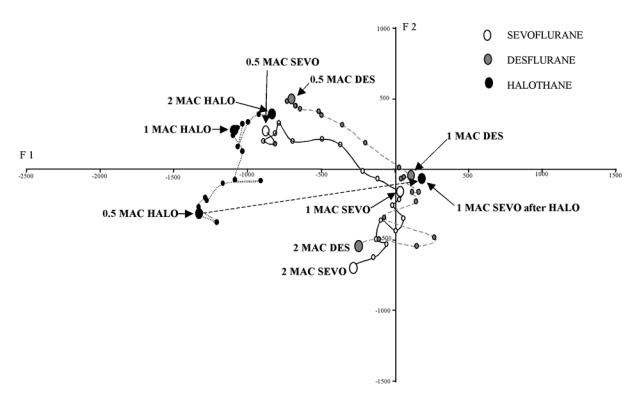
Figure 3.

Change in children’s position in the structured model of the multiple correspondence analysis during decrease in concentration of the three volatile anaesthetic agents. Each point represents one minute. Larger dots represent steady state. The units of axes F1 and F2 are arbitrary.
